
Page 44 - Basics of MATLAB and Beyond
P. 44
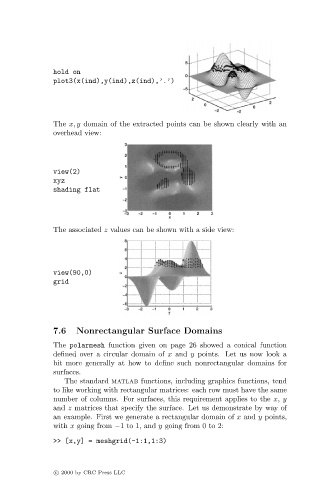
hold on
                               plot3(x(ind),y(ind),z(ind),’.’)


                               The x, y domain of the extracted points can be shown clearly with an
                               overhead view:


                               view(2)
                               xyz
                               shading flat


                               The associated z values can be shown with a side view:


                               view(90,0)
                               grid


                               7.6   Nonrectangular Surface Domains

                               The polarmesh function given on page 26 showed a conical function
                               defined over a circular domain of x and y points. Let us now look a
                               bit more generally at how to define such nonrectangular domains for
                               surfaces.
                                  The standard matlab functions, including graphics functions, tend
                               to like working with rectangular matrices: each row must have the same
                               number of columns. For surfaces, this requirement applies to the x, y
                               and z matrices that specify the surface. Let us demonstrate by way of
                               an example. First we generate a rectangular domain of x and y points,
                               with x going from −1to1,and y going from 0 to 2:

                               >> [x,y] = meshgrid(-1:1,1:3)


                               c   2000 by CRC Press LLC