
Page 42 - Basics of MATLAB and Beyond
P. 42
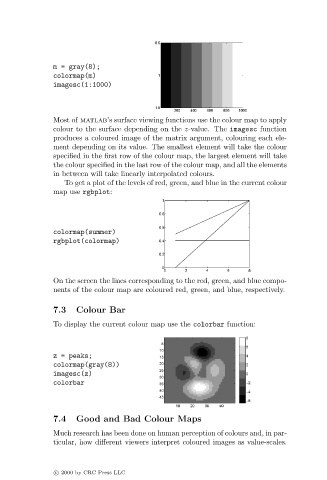
m = gray(8);
                               colormap(m)
                               imagesc(1:1000)


                               Most of matlab’s surface viewing functions use the colour map to apply
                               colour to the surface depending on the z-value. The imagesc function
                               produces a coloured image of the matrix argument, colouring each ele-
                               ment depending on its value. The smallest element will take the colour
                               specified in the first row of the colour map, the largest element will take
                               the colour specified in the last row of the colour map, and all the elements
                               in between will take linearly interpolated colours.
                                  To get a plot of the levels of red, green, and blue in the current colour
                               map use rgbplot:


                               colormap(summer)
                               rgbplot(colormap)


                               On the screen the lines corresponding to the red, green, and blue compo-
                               nents of the colour map are coloured red, green, and blue, respectively.


                               7.3   Colour Bar
                               To display the current colour map use the colorbar function:


                               z = peaks;
                               colormap(gray(8))
                               imagesc(z)
                               colorbar


                               7.4   Good and Bad Colour Maps
                               Much research has been done on human perception of colours and, in par-
                               ticular, how different viewers interpret coloured images as value-scales.


                               c   2000 by CRC Press LLC