
Page 40 - Basics of MATLAB and Beyond
P. 40
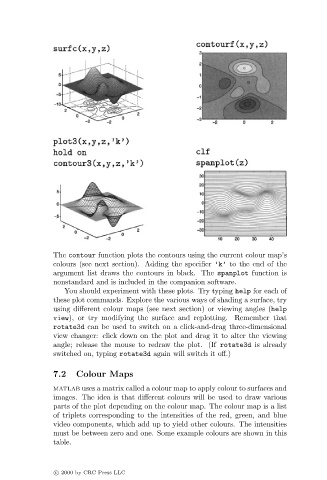
The contour function plots the contours using the current colour map’s
                               colours (see next section). Adding the specifier ’k’ to the end of the
                               argument list draws the contours in black. The spanplot function is
                               nonstandard and is included in the companion software.
                                  You should experiment with these plots. Try typing help for each of
                               these plot commands. Explore the various ways of shading a surface, try
                               using different colour maps (see next section) or viewing angles (help
                               view), or try modifying the surface and replotting. Remember that
                               rotate3d can be used to switch on a click-and-drag three-dimensional
                               view changer: click down on the plot and drag it to alter the viewing
                               angle; release the mouse to redraw the plot. (If rotate3d is already
                               switched on, typing rotate3d again will switch it off.)

                               7.2   Colour Maps

                               matlab uses a matrix called a colour map to apply colour to surfaces and
                               images. The idea is that different colours will be used to draw various
                               parts of the plot depending on the colour map. The colour map is a list
                               of triplets corresponding to the intensities of the red, green, and blue
                               video components, which add up to yield other colours. The intensities
                               must be between zero and one. Some example colours are shown in this
                               table.


                               c   2000 by CRC Press LLC