
Page 48 - Basics of MATLAB and Beyond
P. 48
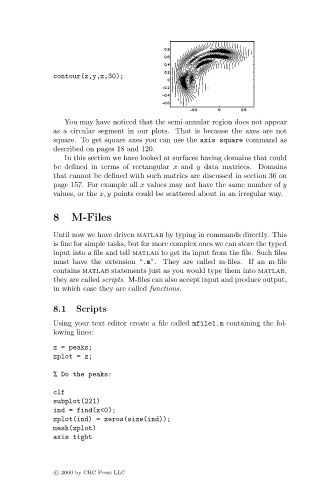
contour(x,y,z,30);


                                  You may have noticed that the semi-annular region does not appear
                               as a circular segment in our plots. That is because the axes are not
                               square. To get square axes you can use the axis square command as
                               described on pages 18 and 120.
                                  In this section we have looked at surfaces having domains that could
                               be defined in terms of rectangular x and y data matrices. Domains
                               that cannot be defined with such matrics are discussed in section 36 on
                               page 157. For example all x values may not have the same number of y
                               values, or the x, y points could be scattered about in an irregular way.


                               8    M-Files

                               Until now we have driven matlab by typing in commands directly. This
                               is fine for simple tasks, but for more complex ones we can store the typed
                               input into a file and tell matlab to get its input from the file. Such files
                               must have the extension “.m”. They are called m-files. If an m-file
                               contains matlab statements just as you would type them into matlab,
                               they are called scripts. M-files can also accept input and produce output,
                               in which case they are called functions.

                               8.1   Scripts

                               Using your text editor create a file called mfile1.m containing the fol-
                               lowing lines:

                               z = peaks;
                               zplot = z;
                               % Do the peaks:


                               clf
                               subplot(221)
                               ind = find(z<0);
                               zplot(ind) = zeros(size(ind));
                               mesh(zplot)
                               axis tight


                               c   2000 by CRC Press LLC