
Page 349 - Battery Reference Book
P. 349
30/20 Primary batteries
2o r
1 1 .oo ° . O h
' 5 O b
b
b
J
1 10 loo0
Hours of service
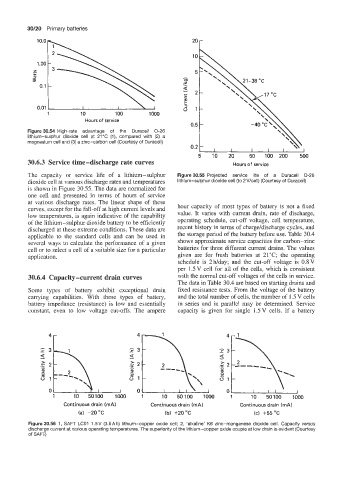
Figure 30.54 High-rate advantage of the Duracell 0-26 0.5 t
lithium-sulphur dioxide cell at 21°C (I), compared with (2) a
magnesium cell and (3) a zinc-carbon cell (Courtesy of Duracell) -40 OC'\ bI
5 . IO 20 50 100 200 500
30.6.3 Service time-discharge rate curves Hours of service
The capacity or service life of a lithium-sulphur Figure30.55 Projected service life of a Duracell 0-26
dioxide cell at various discharge rates and temperatures lithium-sulphur dioxide cell (to 2V/cell) (Courtesy of Duraceil)
is shown in Figure 30.55. The data are normalized for
one cell and presented in terms of hours of service
at various discharge rates. The linear shape of these
curves, except for the fall-off at high current levels and hour capacity of most types of battery is not a fixed
low temperatures, is again indicative of the capability value. It varies with current drain, rate of discharge,
of the lithium-sulphur dioxide battery to be efficiently operating schedule, cut-off voltage, cell temperature,
discharged at these extreme conditions. These data are recent history in terms of charge/discharge cycles, and
applicable to the standard cells and can be used in the storage period of the battery before use. Table 30.4
several ways to calculate the performance of a given shows approximate service capacities for carbon-zinc
cell or to select a cell of a suitable size for a particular batteries for three different current drains. The values
application. given are for fresh batteries at 21°C; the operating
schedule is 2Wday; and the cut-off voltage is 0.8V
per 1.5V cell for all of the cells, which is consistent
30.6.4 Capacity-current drain curves with the normal cut-off voltages of the cells in service.
The data in Table 30.4 are based on starting drains and
Some types of battery exhibit exceptional drain fixed resistance tests. From the voltage of the battery
carrying capabilities. With these types of battery, and the total number of cells, the number of 1.5 V cells
battery impedance (resistance) is low and essentially in series and in parallel may be determined. Service
constant, even to low voltage cut-offs. The ampere capacity is given for single 1.5V cells. If a battery
4r 4 4
-
z 3
a
.- 22 0
m
Q
51 0 1
\
0
0 0 I J
50100
10
1000
1 10 50100 1000 1 1 10 50100 1000
;f\.\J
Continuous drain (mA) Continuous drain (mA) Continuous drain (mA)
(a) -20 "C (b) +20°C (c) +55 OC
Figure 30.56 1, SAFT LCOl 1.5V (3.6Ah) lithium-copper oxide cell; 2, 'alkaline' K6 zinc-manganese dioxide cell. Capacity versus
discharge current at various operating temperatures. The superiority of the lithium-copper oxide couple at low drain is evident (Courtesy
of SAFTj