
Page 344 - Battery Reference Book
P. 344
Voltage-capacity curves 30115
I 1 I 1 I I J
1 2 3 4 5 6 1 I I I 1 1 1
0 1 2 3 4 5 6
Capacity (A h)
Capacity (Ah)
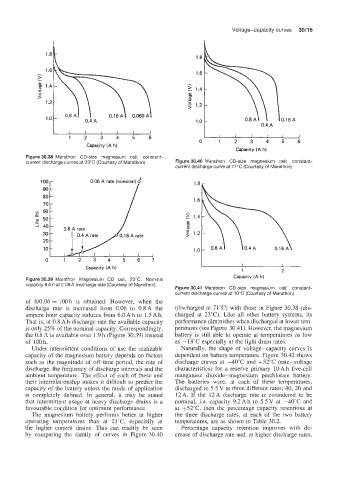
Figure 30.38 Marathon CD-size magnesium cell: constant-
current discharge curves at 23°C (Courtesy of Marathon) Figure 30.40 Marathon CD-size magnesium cell: constant-
current discharge curve at 71 "C (Courtesy of Marathon)
100
90
80
70
1 60
.c
1
o 50
20
10
0 1 2 3 4 5 6 7
Capacizy (A h)
1 2
Capacity (A h)
Figure 30.39 Marathon Magnesium CD cell, 23°C. Nominal
capacity 6A h at 0.06A discharge rate (Courtesy of Marathon)
Figure 30.41 Marathon CD-size magnesium cell: constant-
current discharge curves at 10°C (Courtesy of Marathon)
of 610.06 = 1OOh is obtained. However, when the
discharge rate is increased from 0.06 to 0.8A the (discharged at 71°C) with those in Figure 30.38 (dis-
ampere hour capacity reduces from 6.0 Ah to 1.5 Ah. charged at 23°C). Like all other battery systems, its
That is, at 0.8 Ah discharge rate the available capacity performance diminishes when discharged at lower tem-
is only 25% of the nominal capacity. Correspondingly, peratures (see Figure 30.41). However, the magnesium
the 0.8 A is available over 1.9 h (Figure 30.39) instead battery is still able to operate at temperatures as low
of 100 h. as -18°C especially at the light drain rates.
Under intermittent conditions of use the realizable Naturally, the shape of voltage-capacity curves is
capacity of the magnesium battery depends on factors dependent on battery temperature. Figure 30.42 shows
such as the magnitude of off-time period, the rate of discharge curves at -40°C and f52"C (rate-voltage
discharge, the frequency of discharge intervals and the characteristics) for a reserve primary 10A h five-cell
ambient temperature. The effect of each of these and manganese dioxide-magnesium perchlorate battery.
their inten-elatJonship makes it difficult to predict the The batteries were, at each of these temperatures,
capacity of the battery unless the mode of appiication discharged to 5.5 V at three different rates; 40, 20 and
is completely defined. In general. it may be stated 12A. If the 12A discharge rate is considered to be
that intermittent usage at heavy discharge drains is a nominal, i.e. capacity 9.2Ah to 5.5V at -40°C and
favourable cor,dition for optimum performance. at +52"C, then the percentage capacity retentions at
The magnesium battery performs better at higher the three discharge rates, at each of the two battery
operating temperatures than at 2 1 "C, especially at temperatures, are as shown in Table 30.2.
the higher current drains. This can readily be seen Percentage capacity retention improves with de-
by comparing the family of curves in Figure 30.40 crease of discharge rate and, at higher discharge rates,