
Page 345 - Battery Reference Book
P. 345
30/16 Primary batteries
1 or-
1.01 I I I I I , I I I , 1
0 100 300 500 700 900 1100
Capacity (A h/cell)
40A 20A 12 A
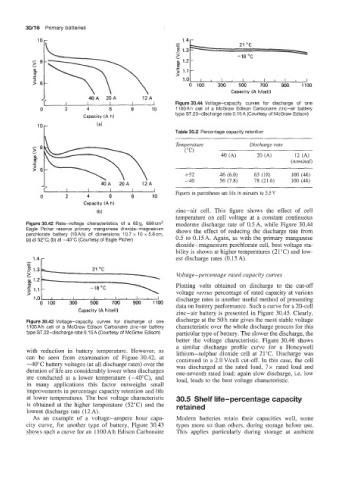
I I I I 1 Figure 30.44 Voltage-capacity curves for discharge of one
0 2 4 6 8 10 IlOOAh cell of a McGraw Edison Carbonaire zinc-air battery
type ST.23-discharge rate 0.15A (Courtesy of McGraw Edison)
Capacity (Ah)
lor (a)
Table 30.2 Percentage capacity retention
Temperature Discharge rate
("C)
40 (A) 20 (A) 12 (A)
(nominal)
+52 46 (6.0) 65 (18) 100 (46)
-40 56 (7.8) 78 (21.6) 100 (46)
40A 20A 12A
I I I I J Figures in parentheses are life in minutes to 5.5 V
0 2 4 6 8 10
Capacity (A h)
(b) zinc-air cell. This figure shows the effect of cell
temperature on cell voltage at a constant continuous
Figure 30.42 Rate-voltage characteristics of a 60 g, 656crn3 moderate discharge rate of OSA, while Figure 30.44
Eagle Picher reserve primary manganese dioxide-magnesium shows the effect of reducing the discharge rate from
perchlorate battery (1 OA h) of dimensions 10.7 x 10 x 5.6 cm,
(a) at 52°C; (b) at -40°C (Courtesy of Eagle Picher) 0.5 to 0.15A. Again, as with the primary manganese
dioxide-magnesium perchlorate cell, best voltage sta-
bility is shown at higher temperatures (21°C) and low-
1.4 r est discharge rates (0.15 A).
_____.
Voltage-percentage rated capacity curves
: ll"c
,.IC
Plotting volts obtained on discharge to the cut-off
-18 'C
voltage versus percentage of rated capacity at various
discharge rates is another useful method of presenting
0 100 300 500 700 900 1100 data on battery performance. Such a curve for a 20-cell
Capacity IA h/cell)
zinc-air battery is presented in Figure 30.45. Clearly,
Figure 30.43 Voltage-capacity curves for discharge of one discharge at the 50 h rate gives the most stable voltage
IlOOAh cell of a McGraw Edison Carbonaire zinc-air battery characteristic over the whole discharge process for this
type ST.22-discharge rate 0.15A (Courtesy of McGraw Edison) particular type of battery. The slower the discharge, the
better the voltage characteristic. Figure 30.46 shows
a similar discharge profile curve for a Honeywell
with reduction in battery temperature. However, as lithium-sulphur dioxide cell at 21°C. Discharge was
can be seen from examination of Figure 30.42, at continued to a 2.0 Vkell cut-off. In this case, the cell
-40°C battery voltages (at all discharge rates) over the was discharged at the rated load, 7x rated load and
duration of life are considerably lower when discharges one-seventh rated load; again slow discharge, i.e. low
are conducted at a lower temperature (-4o"C), and load, leads to the best voltage characteristic.
in many applications this factor outweighs small
improvements in percentage capacity retention and life
at lower temperatures. The best voltage characteristic 30.5 Shelf life-percentage capacity
is obtained at the higher temperature (52°C) and the retained
lowest discharge rate (12 A).
As an example of a voltage-ampere hour capa- Modem batteries retain their capacities well, some
city curve, for another type of battery, Figure 30.43 types more so than others, during storage before use.
shows such a curve for an 1100 Ah Edison Carbonaire This applies particularly during storage at ambient