
Page 340 - Battery Reference Book
P. 340
Effect of operating temperature on service life
700
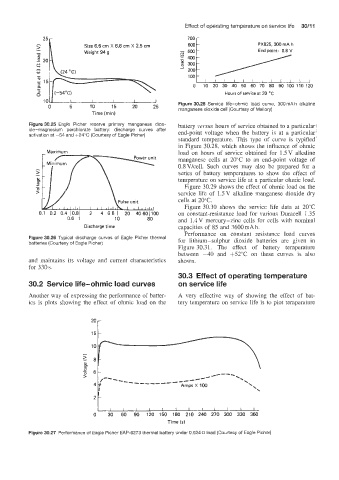
Size 6.6 cm X 6.6 cm X 2.5 cm 600 PX825,300 mA h
Weight 94 g End point: 0.8 Y
300
200
100
0 10 20 30 40 50 60 70 80 90 100 110 120
Hours of service at 20 OC
0 5 10 15 20 25 Figure 30.28 Service life-ohmic load curve, 300 mA h alkaline
manganese dioxide cell (Courtesy of Mailory)
Time (min)
Figure 30.25 Eafile Picher reserve primary manganese diox- battery versus hours of service obtained to a particular
ide-magnesium perchlorate battery: discharge curves after end-point voltage when the battery is at a particular
activation at -54 and +24“C (Courtesy of Eagle Picher)
standard temperature. This type of curve is typified
in Figure 30.28, which shows the influence of ohmic
Maximum
Maximum load on hours of service obtained for 1.5V alkaline
t t manganese cells at 20°C to an end-point voltage of
0.8V/cell. Such curves may also be prepared for a
> series of battery temperatures to show the effect of
temperature on service life at a particular ohmic load.
c Figure 30.29 shows the effect of ohmic load on the
0
> service life of 1.5 V alkaline manganese dioxide dry
cells at 20°C.
Figure 30.30 shows the service life data at 20°C
0.1 0.2 0.4 10.81
0.1-0 I . 2 4 6 8 I 20 40 601100 on constant-resistance load for various Duracell 1.35
0.6 1 10 80 and 1.4V mercury-zinc cells for cells with nominal
Discharge time capacities of 85 and 3600 mA h.
Performance on constant resistance load curves
Figure 30.26 Typical discharge curves of Eagle Picher thermal for lithium-sulphur dioxide batteries are given in
batteries (Courtesy of Eagle Picher)
Figure 30.31. The effect of battery temperature
between -40 and +52”C on these curves is also
and maintains its voltage and current characteristics shown.
for 330s.
30.3 Effect of operating temperature
30.2 Service life-ohmic load curves on service life
Another way of expressing the performance of batter- A very effective way of showing the effect of bat-
ies is plots showing the effect of ohmic load on the tery temperature on service life is to plot temperature
10
0
---
6 /e--- ..
---_-____-
_-e4
\
4 Amps X 100 \
‘“r
2
0 30 60 90 120 150 180 210 240 270 300 330 360
Time ($1
Figure 30.27 Performance of Eagle Picher EAP-6273 thermal battery under 0.024 Q load (Courtesy of Eagle Picher)