
Page 339 - Battery Reference Book
P. 339
30/10 Primary batteries
4 Focv
I
0 0.2 0.4 1.0 3.0 5.0 10 20 30-50
0 1 2 3 4 5 6 7 8
Time (h) Discharge time (h)
Figure 30.20 Honeywell lithium-thionyl chloride cell: discharge Figure 30.22 Typical discharge curves: Duracell lithium-man-
performance at -29°C after 2 weeks' storage at 74°C; loads ganese dioxide 2N size cell (20°C) (Courtesy of Duracell)
120 mA (30 min) to 45 mA (30 min): electrolyte 1.5 M LiAIC14.SOC12
plus 5 wt% sulphur dioxide (Courtesy of Honeywell)
'r
zll
100
0
200
600
700
800
300
400
500
0 20 40 60 80
Time (s)
Time (ms)
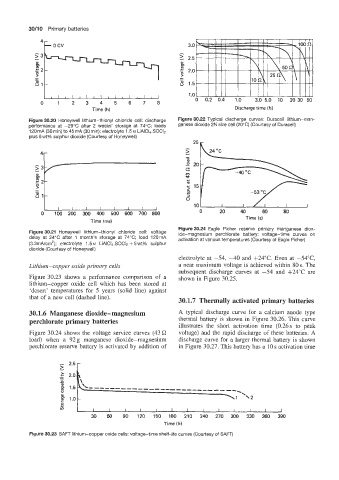
Figure 30.24 Eagle Picher reserve primary manganese diox-
Figure 30.21 Honeywell lithium-thionyl chloride cell: voltage ide-magnesium perchlorate battery: voltage-time curves on
delay at 24°C after 1 month's storage at 74°C; load 120mA activation at various temperatures (Courtesy of Eagle Picher)
(3.3mNcm'); electrolyte 1.5 M LiAIC14.SOC12 + 5 wt% sulphur
dioxide (Courtesy of Honeywell)
electrolyte at -54, -40 and +24"C. Even at -54"C,
Lithium-copper oxide primary cells a near maximum voltage is achieved within 80 s. The
subsequent discharge curves at -54 and +24T are
Figure 30.23 shows a performance comparison of a shown in Figure 30.25.
lithium-copper oxide cell which has been stored at
'desert' temperatures for 5 years (solid line) against
that of a new cell (dashed line).
30.1.7 Thermally activated primary batteries
30.1.6 Manganese dioxide-magnesium A typical discharge curve for a calcium anode type
perchlorate primary batteries thermal battery is shown in Figure 30.26. This curve
illustrates the short activation time (0.26 s to peak
Figure 30.24 shows the voltage service curves (43 C2 voltage) and the rapid discharge of these batteries. A
load) when a 92 g manganese dioxide-magnesium discharge curve for a larger thermal battery is shown
perchlorate reserve battery is activated by addition of in Figure 30.27. This battery has a 10 s activation time
W
1.0
s
v)
30 60 90 120 150 180 210 240 270 300 330 360 390
Time (h)
Figure 30.23 SAFT lithium-copper oxide cells: voltage-time shelf-life curves (Courtesy of SAFT)