
Page 338 - Battery Reference Book
P. 338
Service time-voltage data 30/9
- 3.0
> 2.6
I
0 2.2
+-
5 1.8
> n
1.4
0.0 0.2 0.5 1 2 5 10 20 50 100
Service time (h)
la) L0.32, 1.1 A h
3.0
3 2.6
1
g 2.2
m 0 10 20 30 40 5D
% 1.8
> Time (h)
1.4
I I I>,,lJuL,,,#l 1 I I lllliillillllll I I I !V~lW
0.0 0.2 0.5 1 2 5 10 20 50 100 Figure 30.17 Discharge curve of a lithium-sulphur dioxide cell at
20°C (Courtesy of Mallory)
0.1 0.3 Service time (h)
(bl L0.26, 10.0 A h
Figure 30.15 Discharge performance of Mallory lithium-sulphur
dioxide batteries at 21 "C (Courtesy of Mallory)
3'0h
- 2.8
2 2.6
W
cn
c -
3 2.4
0 10 20 30 40 50
2.2 Time (h)
Figure 30.18 Discharge curve of a lithium-sulphur dioxide cell at
2.0 -30°C (Courtesy of Mallory)
10 20 30
Hours of service
4.0
Figure 30.16 Typical discharge characteristics of a lithium-
I
sulphur dioxide cell at various temperatures at C/30 rate -
2 3.0
(Couriesy of Mallory) m .-
s
c
c 2.0
a 1.0 1
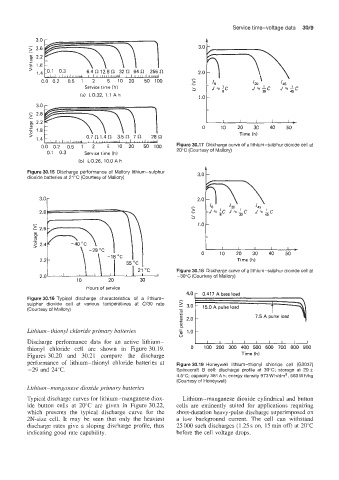
Lithium-thionyl chloride primary batteries %2
0
Discharge performance data for an active lithium- I I I I I I I l l
thionyl chloride cell are shown in Figure 30.19. 0 100 200 300 400 500 600 700 800 900
Figures 30.20 and 30.21 compare the discharge Time (h)
performance of lithium-thionyl chloride batteries at Figure 30.19 Honeywell lithium-thionyl chloride cell (G3037)
-29 and 24°C. Spacecraft B cell: discharge profile at 30°C; storage at 29f
45°C; capacity 381 Ah; energy density 973 W h/drn3, 563 W h/kg
(Courtesy of Honeywell)
Lithium-manganese dioxide primary batteries
Typical discharge curves for lithium-manganese diox- Lithium-manganese dioxide cylindrical and button
ide button cel1.s at 20°C are given in Figure 30.22, cells are eminently suited for applications requiring
which presents the typical discharge curve for the short-duration heavy-pulse discharge superimposed on
2N-size cell. It may be seen that only the heaviest a low background current. The cell can withstand
discharge rates give a sloping discharge profile, thus 25 000 such discharges (1.25 s on, 15 min off? at 20°C
indicating good rate capability. before the cell voltage drops.