Page 348 - Battery Reference Book
P. 348

Other characteristic cuwes  30/19

                                                30.6 Other characteristic curves
      a                                         30.6.1  Internal resistance
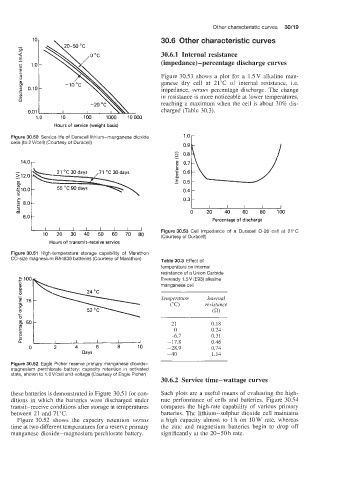
       E                                         (impedance) -percentage  discharge curves
          1.0
       E
                                                Figure  30.53 shows  a  plot  for  a  1.5V alkaline  man-
                                                 ganese  dry  cell  at  21°C  of  internal  resistance,  i.e.
       E  0.10                                   impedance,  versus  percentage  discharge.  The change
      .-  P                                      in resistance is more noticeable at lower temperatures,
      0
                                                 reaching  a maximum  when the cell is about 30% dis-
                                                 charged (Table 30.3).
            1 .Q   10     loo   loo0   loo00
                 Hours of service (weight basis)
                                                       1 .o
    Figure 30.50  Service life of Duracell lithium-manganese dioxide
    cells (to 2V/cell) (Courtesy  of Duracell)
                                                       0.9
                                                     -
                                                     c 0.8
       14.0 p                                          Q.7
      -                                              $  0.6
      -
                                                     a
      > 12.0
                                                     5  0.5
      W 0
      2 10.0                                           0.4
      P
      z                                                0.3
      c 8.0
      c
      d                                                  0    20   40    60   80   100
        6.0                                                     Percentage of discharge
                       I   I   I   I   I   I     Figure30.53  Cell  impedance of  a  Duracell  0-26  cell  at  21°C
              10   20  30  40  50  60  70  80    (Courtesy  of  Duracell)
                Houn of transmit-receive service
    Figure 30.51  High-temperature storage capability  of  Marathon
    CD-size magnesium BA4836 batteries (Courtesy of Marathon)   Table 30.3  Effect of
                                                 temperature on internal
                                                 resistance of a Union Carbide
                                                 Eveready 1.5V (E93) alkaline
                                                 manganese cell
                                                 Temperature   Internal
                                                   ("C)       resistance
                                                                (a)
                                                    21          0.18
                                                     0          0.24
                                                   -6.7         0.31
                                                   -17.8        0.46
                                                   -28.9        0.74
                         Days                      -40          1.14
    Figure 30.52  Eagle Picher reserve primary manganese dioxide-
    magnesium perchlorate battery: capacity  retention in activated
    state, shown to 1 .OV/cell end-voltage (Courtesy of Eagle Picher)
                                                 30.6.2  Service time-wattage  curves
    these batteries is demonstrated in Figure  30.5 1 for con-   Such plots  are a useful means of  evaluating  the high-
    ditions  in  which  the  batteries  were  discharged  under   rate  performance  of  cells  and  batteries.  Figure  30.54
    transit-receive  conditions after storage at temperatures   compares  the  high-rate  capability  of  various  primary
    between  21 and 71°C.                        batteries.  The lithium-sulphur  dioxide cell maintains
      Figure  30.52  shows  the  capacity  retention  versus   a  high  capacity  almost  to  1 h  on  10 W  rate,  whereas
    time at two different temperatures for a reserve primary   the  zinc  and  magnesium  batteries  begin  to  drop  off
    manganese  dioxide-magnesium  perchlorate  battery.   significantly at the 20-50  h rate.
   343   344   345   346   347   348   349   350   351   352   353