
Page 42 - Battery Reference Book
P. 42
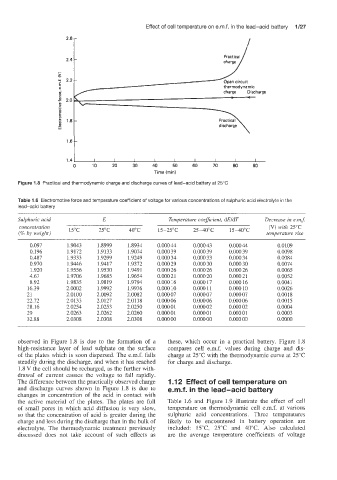
Effect of  cell temperature on e.m.f. in the lead-acid  battery  1/27
                                                                   charge /


                     2.4  .                                        Practical


                                                                   thermodynamic
                                                                   charge   Discharge


                       i


                     1.4 L I             I     I     I     I     I    I     I
                       0    10    20    30    40    50    60    70    80    90
                                               Time (min)
      Figure 1.8  Practical and thermodynamic charge and discharge curves of lead-acid  battery at 25°C

      Table 1.6  Electromotive force and temperature coefficient of  voltage for various concentrations of sulphuric acid electrolfle  in the
      lead-acid  battery
      Sulphuric acid           E                   Temperature coeficient, dEldT   Decrease in e.m$
       concentration   15°C                                                     (V) with  25°C
       (5% by weight)         25°C     40°C     15-25°C   25-40°C    15-40°C    temperature  rise

          0.097      1.9043   1.8999   1.8934   0.000 44   0.000 43   0.000 44     0.0109
          0.196      1.9172   1.9133   1.9074   0.000 39   0.000 39   0.000 39     0.0098
          0.487      1.9333   1.9299   1.9249   0.000 34   0.000 33   0.000 34     0.0084
          0.970      1.9446   1.9417   1.9372   0.000 29   0.000 30   0.000 30     0.0074
          1.920      1.9556   1.9530   1.9491   0.000 26   0.000 26   0.000 26     0.0065
          4.67       1.9706   1.9685   1.9654   0.000 21   0.000 20   0.000 21     0.0852
          8.92       1.9835   1.9819   1.9794   0.000 16   0.000 17   0.000 16     0.0041
         16.39       2.0002   1.9992   1.9976   0.000 10   0.000  11   0.000 10    0.0026
         21          2.0100   2.0092   2.0082   0.000 07   0.000 07   0.000 07     0.0018
         22.72       2.0133   2.0127   2.0118   0.000 06   0.000 06   0.000 06     0.0015
         28.16       2.0254   2.0253   2.0250   0.00001   0.000 02   0.000 02      0.0004
         29          2.0263   2.0262   2.0260   0.000 01   0.000 01   0.000 01     0.0003
         32.88       2.0308   2.0308   2.0308   0.000 00   0.000 00   0.00000      0.0000


      observed  in  Figure  1.8  is  due  to  the  formation  of  a   these,  which  occur  in  a  practical  battery.  Figure  1.8
      high-resistance  layer  of  lead  sulphate  on  the  surface   compares  cell  e.m.f.  values  during  charge  and  dis-
      of  the plates  which is soon dispersed. The e.m.f. falls   charge at 25°C with the thermodynamic curve at 25°C
      steadily during the discharge, and when it has reached   for charge and discharge.
      1.8 V the cell should be recharged, as the further with-
      drawal  of  current  causes  the  voltage  to  fall  rapidly.
      The difference between the practically observed charge   1.1 2  Effect of cell temperature o
      and  discharge  curves  shown  in  Figure  1.8 is  due  to   e.m.f. in the lead-acid  battery
      changes  in  concentration  of  the  acid  in  contact  with
      the  active  material  of  the  plates.  The plates  are  full   Table 1.6  and  Figure  1.9 illustrate  the  effect  of  cell
      of  small  pores  in  which  acid  diffusion  is very  slow,   temperature  on thermodynamic  cell  e.m.f.  at  various
      so that the concentration  of  acid is greater during the   sulphuric  acid  concentrations.  Three  temperatures
      charge and less during the discharge than in the bulk of   likely  to  be  encountered  in  battery  operation  are
      electrolyte.  The  thermodynamic  treatment  previously   included:  WC,  25°C  and  40°C.  Also  calculated
      discussed  does  not  take  acco'unt of  such  effects  as   are  the  average  temperature  coefficients  of  voltage