
Page 49 - Battery Reference Book
P. 49
1/34 Introduction to battery technology
The volume reduction in acid during discharge is 1.14-
VF - VI = 1624 - 1509 = 115ml
1.12
1 .I8 Calculation of optimum acid
volume for a cell
It is obvious in the battery discussed above that dis-
charge has occurred to such an extent that the acid c
relative density has been reduced to the point that TI c
$'
cell e.m.f. would reduce appreciably, i.e. we have .- 1.06
entered the region of overdischarge, which is not re- c
commended. To overcome this a further battery is stud- a
ied in which the initial volume, VI, of acid is increased
from 1.624 litre by various amounts up to 5 litres.
The relative density (&), percentage weight concen- 1.02
tration (Cz) and final volume (VF) of electrolyte at end
of discharge are calculated as above. The results are
presented in Table 1.8. This table enables one to select, - 1 0 1000 2000 3000 4000 5000
for the particular cell in question, a volume of acid to
use in the cell which will be adequate to maintain the Initial volume of sulphuric acid (ml)
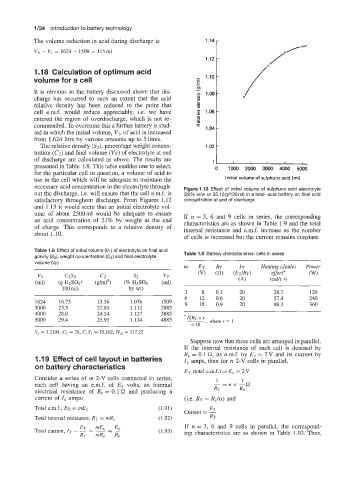
necessary acid concentration in the electrolyte through- Figure 1.13 Effect of initial volume of sulphuric acid electrolyte
out the discharge, i.e. will ensure that the cell e.m.f. is (29% w/w or 35.10g/lOOml) in a lead-acid battery on final acid
satisfactory throughout discharge. From Figures 1.12 concentration at end of discharge
and 1.13 it would seem that an initial electrolyte vol-
ume of about 2500ml would be adequate to ensure If n = 3, 6 and 9 cells in series, the corresponding
an acid concentration of 21% by weight at the end characteristics are as shown in Table 1.9 and the total
of charge. This corresponds to a relative density of internal resistance and e.m.f. increase as the number
about 1.10. of cells is increased but the current remains constant.
Table 1.8 Effect of initial volume (Vj) of electrolyte on final acid
gravity (&), weight concentration (C2) and final electrolyte Table 1.9 Battery characteristics: cells in series
volume (VF)
VI czsz c2 sz VF
(ml) (g H~SO~/ (g/mP) (% H~SO~ (ml)
100 ml) by wt) ~ ~
3 6 0.3 20 28.7 120
6 12 0.6 20 57.4 240
1624 16.75 15.56 1.076 1509 9 18 0.9 20 86.1 360
3000 25.5 22.85 1.112 2885
4000 28.0 24.54 1.127 3885
5000 29.4 25.93 1.134 4885 * I;R~ x t , where t = I
4.18
SI = 1.2104, C1 = 29, ClSl = 35.102, WA = 317.22
Suppose now that these cells are arranged in parallel.
If the internal resistance of each cell is denoted by
R, = 0.1 Q, its e.m.f. by E, = 2V and its current by
1.19 Effect of cell layout in batteries I, amps, then for n 2-V cells in parallel,
on battery characteristics
ET (total e.m.f.) = E, = 2V
Consider a series of m 2-V cells connected in series, 1 1
each cell having an e.m.f. of E, volts, an internal -=nx-Q
electrical resistance of R, = 0.1 C2 and producing a RT Rc
current of I, amps: (Le. RT = R,/n) and
Total e.m.f., ET = mE, (1.91) E
Current = 2
Total internal resistance, RT = mR, (1.92) RT
ET mE E, If n = 3, 6 and 9 cells in parallel, the correspond-
Total current, IT - - = 2 - (1.93) ing characteristics are as shown in Table 1.10. Thus,
=
RT mR, R,