
Page 59 - Battery Reference Book
P. 59
1/44 Introduction to battery technology
second during the rapid discharge is about 30 times
greater than at the lower discharge rate.
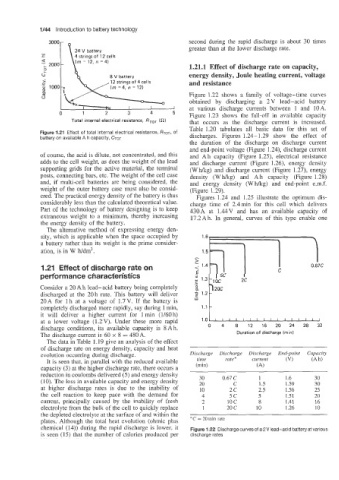
1.21.1 Effect of discharge rate on capacity,
energy density, Joule heating current, voltage
and resistance
Figure 1.22 shows a family of voltage-time curves
obtained by discharging a 2V lead-acid battery
--J at various discharge currents between 1 and 10A.
0 1 2 3 4 5 Figure 1.23 shows the €all-off in available capacity
Total internal electrical resistance, RToT (a) that occurs as the discharge current is increased.
Table 1.20 tabulates all basic data for this set of
Figure 1.21 Effect of total internal electrical resistance, RTOT, Of
battery on available Ah capacity, CTOT discharges. Figures 1.24- 1.29 show the effect of
the duration of the discharge on discharge current
and end-point voltage (Figure 1.24), discharge current
of course, the acid is dilute, not concentrated, and this and Ah capacity (Figure 1.25), electrical resistance
adds to the cell weight, as does the weight of the lead and discharge current (Figure 1.26), energy density
supporting grids for the active material, the terminal (W hkg) and discharge current (Figure 1.27), energy
posts, connecting bars, etc. The weight of the cell case density (W hkg) and Ah capacity (Figure 1.28)
and, if multi-cell batteries are being considered, the and energy density (Whkg) and end-point e.m.f.
weight of the outer battery case must also be consid- (Figure 1.29).
ered. The practical energy density of the battery is thus Figures 1.24 and 1.25 illustrate the optimum dis-
considerably less than the calculated theoretical value. charge time of 2.4min for this cell which delivers
Part of the technology of battery designing is to keep 430A at 1.44V and has an available capacity of
extraneous weight to a minimum, thereby increasing 17.2Ah. In general, curves of this type enable one
the energy density of the battery.
The alternative method of expressing energy den-
sity, which is applicable when the space occupied by 16-
a battery rather than its weight is the prime consider- 1.5 -1
ation, is in W h/dm3.
1.21 Effect of discharge rate on
performance characteristics
Consider a 20 Ah lead-acid battery being completely
discharged at the 20 h rate. This battery will deliver * 1.2
20 A for 1 h at a voltage of 1.7 V. If the battery is ': I
completely discharged more rapidly, say during 1 min, 1.1
it will deliver a higher current for 1 min (1/60h)
at a lower voltage (1.2 V). Under these more rapid 1 .o 0 4 8 12 16 20 24 28 32
discharge conditions, its available capacity is 8 Ah.
The discharge current is 60 x 8 = 480A. Duration of discharge Iminl
The data in Table I. 19 give an analysis of the effect
of discharge rate on energy density, capacity and heat
evolution occurring during discharge. Discharge Discharge Discharge End-point
It is seen that, in parallel with the reduced available time rate * current (VI
capacity (3) at the higher discharge rate, there occurs a (min) (A)
reduction in coulombs delivered (5) and energy density
(IO). The loss in available capacity and energy density 30 0.67 C 1 1.6 30
20
C
30
1.59
1.5
at higher discharge rates is due to the inability of 10 2c 2.5 1.56 25
the cell reaction to keep pace with the demand for 4 5c 5 1.51 20
current, principally caused by the inability of fresh 2 10 c 8 1.41 16
electrolyte from the bulk of the cell to quickly replace 1 20 c 10 1.26 10
the depleted electrolyte at the surface of and within the
plates. Although the total heat evolution (ohmic plus * C = 20 min rate
chemical (14)) during the rapid discharge is lower, it Figure 1.22 Discharge curves of a 2 V lead-acid battery at various
is seen (15) that the number of calories produced per discharge rates