Page 61 - Battery Reference Book
P. 61

1/46  Introduction to battery technology
            to select the desired combination of  the various para-                Capacity (Ah)
            meters that would be required in battery service.                            X
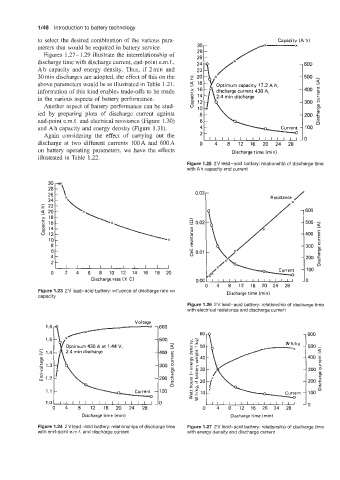
              Figures  1.27 - 1.29 illustrate the interrelationship of   26
            discharge time with discharge current, end-point e.m.f.,
            Ah capacity  and  energy density. Thus,  if  2min and                         1 6oo
            30 min discharges are adopted, the effect of this on the                      -  500 -
                                                                                               a
            above parameters would be as illustrated in Table 1.2 1.                      - 400  E
                                                                                               I
            Information of this kind enables trade-offs to be made   discharge current 430 A,   E!
            in the various aspects of battery performance.       2.4 min discharge        - 300   2
              Another aspect of battery performance can be stud-   10                     - 200 ;
                                                                                               P
            ied  by  preparing  plots  of  discharge  current  against   8
            end-point e.m.f. and electrical resistance (Figure 1.30)                           6
            and Ah capacity and energy density (Figure 1.31).                            ,  - 100
              Again  considering  the  effect  of  carrying  out  the
            discharge  at  two  different  currents  lOOA  and  600A   0   4   8   12   16   20   24   28
            on battery  operating parameters, we have  the  effects   Discharge time (min)
            illustrated in Table 1.22.
                                                         Figure 1.25  2V lead-acid battery: relationship of discharge time
                                                         with Ah capacity and current

               30
                                                           0.03 r                 Resistance /
               24
                                                                                          1600
                                                                                           - 500 2
             'ii  16
                                                                                               I
                14                                                                         -400  E
             0  12                                                                              t
                10                                                                         - 300  $
                                                                                                :
                                                                                           -200  5
                                                                                               6
                                                                                           -  100
                0    2   4   6   8   10   12  14  16   18  20
                            Discharge rate (X C\                                            0
                                                              0   4   8   12   16  20  24   28
             Figure 1.23 2V lead-acid  battery: influence of discharge rate on   Discharge time (min)
             capacity
                                                         Figure 1.26 2 V lead-acid  battery: relationship of discharge time
                                                         with electrical resistance and discharge current

                                               -600
                           --x-X
                                               -  500  -
                     Optimum 430 A at 1.44 V,       a                                      - 500
                                                    I                                           4
                                               -400  '$                                         I
                                                    E                                      - 400  E
                                                    3                                           E
                                               -300                                        - 300 $
                                                    F
                                                                                                P
                                               -200  $                                     - 200 ;
                                                    .-
                                                    n                                           Y)
                                         Current  -  100                                   - 100  6
                                              0
               1         .         0          3  10                                        -0
                 0   4   8   12   16   20   24   28
                          Discharge time (min)                        Discharge time (rnin)
             Figure 1.24  2V lead-acid  battery: relationships of discharge time   Figure 1.27 2V lead-acid battery: relationship of  discharge time
             with end-point e.m.f. and discharge current   with energy density and discharge current
   56   57   58   59   60   61   62   63   64   65   66