
Page 64 - Battery Reference Book
P. 64
Heating effects in batteries 1/49
+45 r- Joule 0.4
+40
+35
+30 - \
I
m
+25 -
Y
+20 g, 0.3
L
+I5 r
m
0
+lo Charge net total, .-
+5 Joule - AH -0
-5 oP-o 0 0 ._
m
L
a
-0
7 0.2
u
0
I
2
- z
a
0
2 0.1
4-
m
I "-------.
ZI -45
$ -50
I l l l l l l l l l i l l l l
2 4 6 8 10 12 14 1618 20222426 28 30
2 -65 Discharge time (rnin)
'& -70 602480300 150 90 60
? -75
0 2 4 6 8 10 12 14 16 18 20 222426 28 30 Jischarge current (A)
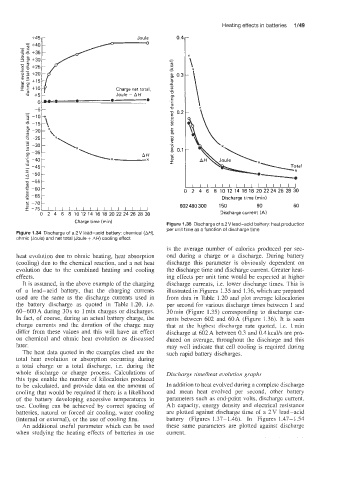
Charge time (rnin) Figure 1.35 Discharge of a 2 V lead-acid battery: heat production
per unit time as a function of discharge time
Figure 1.34 Discharge of a 2V lead-acid battery: chemical (AH),
ohmic (Joule) and net total (Joule + AH) cooling effect
is the average number of calories produced per sec-
heat evolution due to ohmic heating, heat absorption ond during a charge or a discharge. During battery
(cooling) due to the chemical reaction, and a net heat discharge this parameter is obviously dependent on
evolution due to the combined heating and cooling the discharge time and discharge current. Greater heat-
effects. ing effects per unit time would be expected at higher
It is assumed, in the above example of the charging discharge currents, i.e. lower discharge times. This is
of a lead-acid battery, that the charging currents illustrated in Figures 1.35 and 1.36, which are prepared
used are the same as the discharge currents used in from data in Table 1.20 and plot average kilocalories
the battery discharge as quoted in Table 1.20, i.e. per second for various discharge times between 1 and
60-600 A during 30 s to 1 min charges or discharges. 30 min (Figure 1.35) corresponding to discharge cur-
In fact, of course, during an actual battery charge, the rents between 602 and 60A (Figure 1.36). It is seen
charge currents and the duration of the charge may that at the highest discharge rate quoted, i.e. 1 min
differ from these values and this will have an effect discharge at 602 A between 0.3 and 0.4 kcal/s are pro-
on chemical and ohmic heat evolution as discussed duced on average, throughout the discharge and this
later. may well indicate that cell cooling is required during
The heat data quoted in the examples cited are the such rapid battery discharges.
total heat evolution or absorption occurring during
a total charge or a total discharge, Le. during the
whole discharge or charge process. Calculations of Discharge timeheat evolution graphs
this type enable the number of kilocalories produced
to be calculated, and provide data on the amount of In addition to heat evolved during a complete discharge
cooling that would be required if there is a likelihood and mean heat evolved per second, other battery
of the battery developing excessive temperatures in parameters such as end-point volts, discharge current,
use. Cooling can be achieved by correct spacing of Ah capacity, energy density and electrical resistance
batteries, natural or forced air cooling, water cooling are plotted against discharge time of a 2V lead-acid
(internal or external), or the use of cooling fins. battery (Figures 1.37-1.46). In Figures 1.47-2.54
An additional useful parameter which can be used these same parameters are plotted against discharge
when studying the heating effects of batteries in use current.