
Page 116 - Bebop to The Boolean Boogie An Unconventional Guide to Electronics Fundamentals, Components, and Processes
P. 116
Kavnaugh Maps
In 1953, Maurice Karnaugh (pronounced “car-no”) invented a form of logic
diagram1 called a Karnaugh Map, which provides an alternative technique for
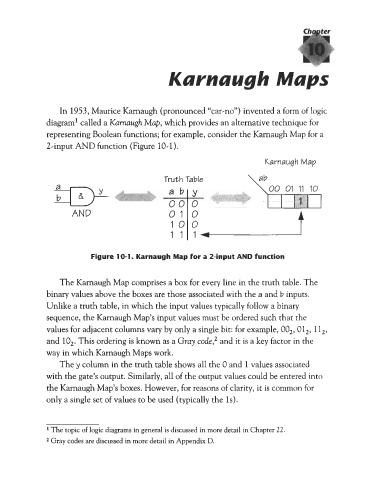
representing Boolean functions; for example, consider the Karnaugh Map for a
2-input AND function (Figure 10-1).
Karnaugh Map
Truth Table
AND
Figure 10-1. Karnaugh Map for a 2-input AND function
The Karnaugh Map comprises a box for every line in the truth table. The
binary values above the boxes are those associated with the a and b inputs.
Unlike a truth table, in which the input values typically follow a binary
sequence, the Karnaugh Map’s input values must be ordered such that the
values for adjacent columns vary by only a single bit: for example, 00,’ 01,’ 1 l,,
and 10,. This ordering is known as a Gray code,, and it is a key factor in the
way in which Karnaugh Maps work.
The y column in the truth table shows all the 0 and 1 values associated
with the gate’s output. Similarly, all of the output values could be entered into
the Karnaugh Map’s boxes. However, for reasons of clarity, it is common for
only a single set of values to be used (typically the 1s).
1 The topic of logic diagrams in general is discussed in more detail in Chapter 22.
2 Gray codes are discussed in more detail in Appendix D.