
Page 150 - Biaxial Multiaxial Fatigue and Fracture
P. 150
The Influence of Static Mean Stresses Applied Normal to the Maximum Shear Planes in ... 135
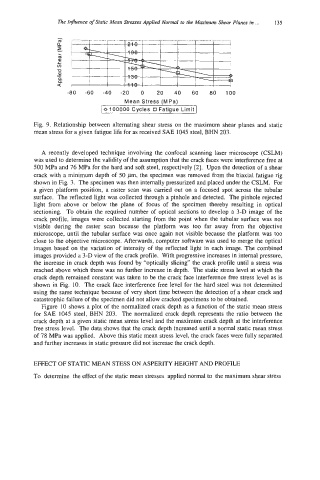
80 -60 -40 -20 0 20 40 60 80 100
Mean Stress (MPa)
i 0 100000 Cycles 0 Fatigue Limit I
Fig. 9. Relationship between alternating shear stress on the maximum shear planes and static
mean stress for a given fatigue life for as received SAE 1045 steel, BHN 203.
A recently developed technique involving the confocal scanning laser microscope (CSLM)
was used to determine the validity of the assumption that the crack faces were interference free at
500 MPa and 76 MPa for the hard and soft steel, respectively [2]. Upon the detection of a shear
crack with a minimum depth of 50 pm, the specimen was removed from the biaxial fatigue rig
shown in Fig. 3. The specimen was then internally pressurized and placed under the CSLM. For
a given platform position, a raster scan was carried out on a focused spot across the tubular
surface. The reflected light was collected through a pinhole and detected. The pinhole rejected
light from above or below the plane of focus of the specimen thereby resulting in optical
sectioning. To obtain the required number of optical sections to develop a 3-D image of the
crack profile, images were collected starting from the point when the tubular surface was not
visible during the raster scan because the platform was too far away from the objective
microscope, until the tubular surface was once again not visible because the platform was too
close to the objective microscope. Afterwards, computer software was used to merge the optical
images based on the variation of intensity of the reflected light in each image. The combined
images provided a 3-D view of the crack profile. With progressive increases in internal pressure,
the increase in crack depth was found by “optically slicing” the crack profile until a stress was
reached above which there was no further increase in depth. The static stress level at which the
crack depth remained constant was taken to be the crack face interference free stress level as is
shown in Fig. 10. The crack face interference free level for the hard steel was not determined
using the same technique because of very short time between the detection of a shear crack and
catastrophic failure of the specimen did not allow cracked specimens to be obtained.
Figure 10 shows a plot of the normalized crack depth as a function of the static mean stress
for SAE 1045 steel, BHN 203. The normalized crack depth represents the ratio between the
crack depth at a given static mean stress level and the maximum crack depth at the interference
free stress level. The data shows that the crack depth increased until a normal static mean stress
of 78 MPa was applied. Above this static mean stress level, the crack faces were fully separated
and further increases in static pressure did not increase the crack depth.
EFFECT OF STATIC MEAN STESS ON ASPERITY HEIGHT AND PROFILE
To determine the effect of the static mean stresses applied normal to the maximum shear stress