
Page 151 - Biaxial Multiaxial Fatigue and Fracture
P. 151
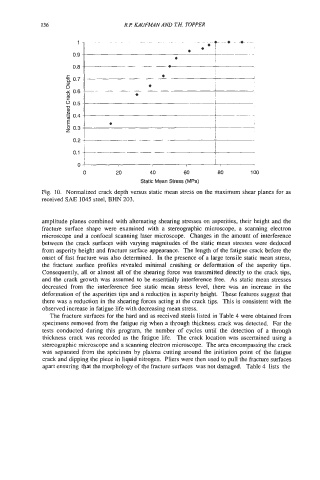
136                    R.€? KAUFMAN AND ZH. TOPPER

                       1-                  I_               i+-*-*  -
                                                      *   *   ;
                      0.9 -
                      0.8

                      0.7 -
                    a,
                    0
                    Y  06-
                    3
                    $ 0.5 -
                    W
                    + 0.4 -
                    E
                      0.3
                      0.2 -
                      0.1 -

                       07                                                I


             amplitude planes combined with alternating shearing stresses on asperities, their height and the
             fracture surface shape were  examined  with  a  stereographic microscope, a  scanning electron
             microscope and a confocal scanning laser microscope.  Changes in the amount of interference
             between the crack surfaces with  varying magnitudes of the static mean  stresses were deduced
             from asperity height and fracture surface appearance.  The length of the fatigue crack before the
             onset of fast fracture was also determined.  In the presence of  a large tensile static mean stress,
             the  fracture surface profiles revealed  minimal  crushing or  deformation  of  the  asperity tips.
             Consequently, all or almost all of the shearing force was transmitted directly to the crack tips,
             and the crack growth was assumed to be essentially interference free.  As static mean stresses
             decreased  from  the  interference free  static  mean  stress  level,  there was  an  increase in  the
             deformation of the asperities tips and a reduction in asperity height.  These features suggest that
             there was a reduction in the shearing forces acting at the crack tips.  This is consistent with the
             observed increase in fatigue life with decreasing mean stress.
               The fracture surfaces for the hard and as received steels listed in Table 4 were obtained from
             specimens removed from the fatigue rig when a through  thickness crack was detected.  For the
             tests  conducted during this  program, the  number  of  cycles until  the detection  of  a  through
             thickness crack was  recorded as the  fatigue life.  The crack location was  ascertained using a
             stereographic microscope and a scanning electron microscope.  The area encompassing the crack
             was  separated from the specimen by plasma cutting around the initiation point of  the fatigue
             crack and dipping the piece in liquid nitrogen.  Pliers were then used to pull the fracture surfaces
             apart ensuring that the morphology of the fracture surfaces  was not damaged.  Table 4  lists  the