
Page 152 - Biaxial Multiaxial Fatigue and Fracture
P. 152
The InJuence of Static Mean Stresses Applied Normal to the Maximum Shear Planes in ... 137
Specimen ID and Alternating Shear Static Mean Stress Fatigue Life
Hardness Level Stress on Maximum Normal to the (Cycles)
Shear Plane (MPa) Maximum Shear
Plane (MPa)
A (BHN 456) 268 547 17913
B (BHN 456) 433 -13 72602
C (BHN 456) 483 -138 55000
D(BHN203) I 187 -60 94 1969
E(BHN203) I 130 100 166234
test conditions of the specimens from which the fracture surfaces were taken for the hard and soft
SAE 1045 steels.
The fracture surfaces were examined using the CSLM technique described previously. The
CSLM software enabled the authors to obtain 2-D line profiles of the fracture surfaces. The
resolution of the confocal laser scanning microscope image processing technique was
approximately 3 pm [30]. For specimens A, B and C, there was adequate resolution and a
satisfactory signal to noise ratio to determine average asperity shape and height. For specimens
D and E, there was too much noise to draw any conclusions from the 2-D line profiles.
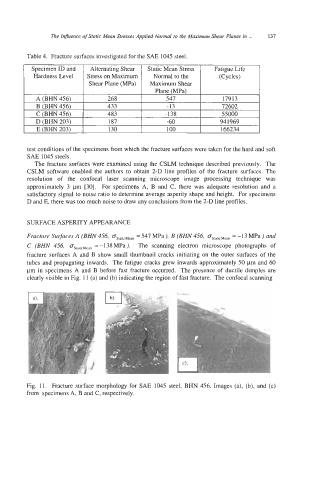
SURFACE ASPERITY APPEARANCE
MPa
-13
Fracture Surfaces A (BHN 456, oSlancMean ), B (BHN 456, oSlal,cMean ) and
MPa
547
=
=
C (BHN 456, oSlatlcMean = -138MPa ). The scanning electron microscope photographs of
fracture surfaces A and B show small thumbnail cracks initiating on the outer surfaces of the
tubes and propagating inwards. The fatigue cracks grew inwards approximately 50 pm and 60
pm in specimens A and B before fast fracture occurred. The presence of ductile dimples are
clearly visible in Fig. 11 (a) and (b) indicating the region of fast fracture. The confocal scanning
Fig. 11. Fracture surface morphology for SAE 1045 steel, BHN 456. Images (a), (b), and (c)
from specimens A, B and C, respectively.