
Page 153 - Biaxial Multiaxial Fatigue and Fracture
P. 153
138 R.P KAWFMAN AND TH. TOPPER
laser microscope images clearly show the amount of deformation at the asperity tips. The
scanning electron microscope image of the fracture surface from specimen C shown in Fig. 11 c)
is relatively featureless. The flattened fracture surface is void of any significant surface features.
It can be hypothesized that the compressive static mean stress normal to the maximum shear planes
was large enough to prevent fast fracture until the fatigue crack propagated through the wall.
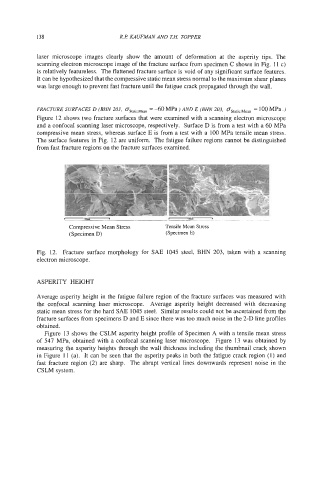
FRACTURE SURFACES D (BHN 203, OStatlc Mean = -60 MPa) AND E (BHN 203, Osstat,, Mean = 100 MPa .)
Figure 12 shows two fracture surfaces that were examined with a scanning electron microscope
and a confocal scanning laser microscope, respectively. Surface D is from a test with a 60 MPa
compressive mean stress, whereas surface E is from a test with a 100 MPa tensile mean stress.
The surface features in Fig. 12 are uniform. The fatigue failure regions cannot be distinguished
from fast fracture regions on the fracture surfaces examined.
Compressive Mean Stress Tensile Mean Stress
(Specimen D) (Specimen E)
Fig. 12. Fracture surface morphology for SAE 1045 steel, BHN 203, taken with a scanning
electron microscope.
ASPERITY HEIGHT
Average asperity height in the fatigue failure region of the fracture surfaces was measured with
the confocal scanning laser microscope. Average asperity height decreased with decreasing
static mean stress for the hard SAE 1045 steel. Similar results could not be ascertained from the
fracture surfaces from specimens D and E since there was too much noise in the 2-D line profiles
obtained.
Figure 13 shows the CSLM asperity height profile of Specimen A with a tensile mean stress
of 547 MPa, obtained with a confocal scanning laser microscope. Figure 13 was obtained by
measuring the asperity heights through the wall thickness including the thumbnail crack shown
in Figure 11 (a). It can be seen that the asperity peaks in both the fatigue crack region (1) and
fast fracture region (2) are sharp. The abrupt vertical lines downwards represent noise in the
CSLM system.