
Page 170 - Biaxial Multiaxial Fatigue and Fracture
P. 170
Fatigue Limit of Ductile Metals Under Multiaxial Loading 155
stresses. The equivalent mean shear stress is still positive and always decreases the fatigue
limit. The equivalent mean normal stress can be positive or negative. A negative mean normal
stress increases the fatigue strength, and a positive mean normal stress decreases the fatigue
strength. In the case of compression, the two effects result in different behaviour of the mean
stress; this depends on the ratio of the coefficients m to n (Eq. (10)). As is shown by the test
results [27], the behaviour markedly differs within the compression range for different
materials.
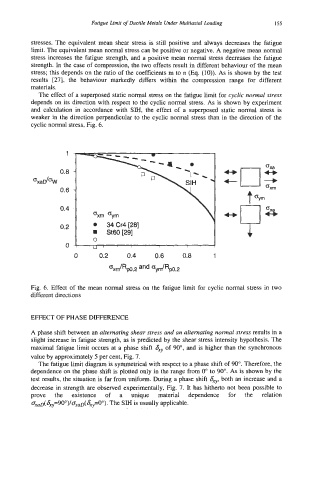
The effect of a superposed static normal stress on the fatigue limit for cyclic normal stress
depends on its direction with respect to the cyclic normal stress. As is shown by experiment
and calculation in accordance with SM, the effect of a superposed static normal stress is
weaker in the direction perpendicular to the cyclic normal stress than in the direction of the
cyclic normal stress, Fig. 6.
1
0.4
Oxm Oym
I
0.2 0 34 Cr4 [28] Y U
B St60[29]
B St60[29]
0
0 I I UI I I I
0 0.2 0.4 0.6 0.8 1
Oxn/Rpo,2 and OydRp0,2
Fig. 6. Effect of the mean normal stress on the fatigue limit for cyciic normal stress in two
different directions
EFFECT OF PHASE DIFFERENCE
A phase shift between an alternating shear stress and an alternating normal stress results in a
slight increase in fatigue strength, as is predicted by the shear stress intensity hypothesis. The
maximal fatigue limit occurs at a phase shift 8, of 90", and is higher than the synchronous
value by approximately 5 per cent, Fig. 7.
The fatigue limit diagram is symmetrical with respect to a phase shift of 90". Therefore, the
dependence on the phase shift is plotted only in the range from 0" to 90". As is shown by the
test results, the situation is far from uniform. During a phase shift a,, both an increase and a
decrease in strength are observed experimentally, Fig. 7. It has hitherto not been possible to
prove the existence of a unique material dependence for the relation
o,,D( 6x,,=90")l~xa~( 8'y=O"). The SM is usually applicable.