
Page 232 - Biaxial Multiaxial Fatigue and Fracture
P. 232
216 A. VARVANI-FARAHANI
In all biaxial tests, the amplitude of (TI and 02 was identical. Figure 7a compares three in-
phase biaxial fatigue tests (Al, B1 and C1) with frequency ratios a equal to 1, 2, and 3,
respectively. Histories B3 (a-2) and C3 (e3) in figure 7c present the out-of-phase test results
when no mean stress is involved. For both in-phase and out-of-phase fatigue test series, the
fatigue strength decreases as the frequency ratio a increases. The lower fatigue strength is
accompanied with a greater fatigue damage due to a greater number of GI cycles in a block
loading history as the frequency ratio Q increases. Figure 7c also presents the detrimental effect
of mean stress on fatigue results when histones B3 and C3 (with no mean stress) are compared
with histories B4 and C4 (with mean stress). The mean stress influence on fatigue damage can
also be observed by comparison of Figs 7a and 7b.
Fatigue life correlation using proposed parameter
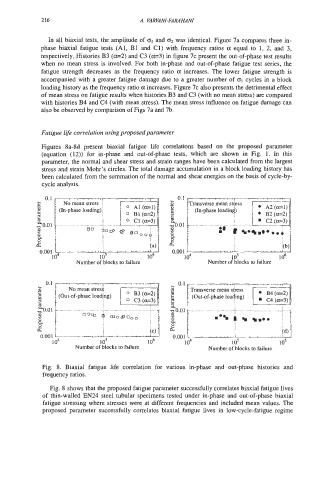
Figures 8a-8d present biaxial fatigue life correlations based on the proposed parameter
(equation (12)) for in-phase and out-of-phase tests, which are shown in Fig. 1. In this
parameter, the normal and shear stress and strain ranges have been calculated from the largest
stress and strain Mohr's circles. The total damage accumulation in a block loading history has
been calculated from the summation of the normal and shear energies on the basis of cycle-by-
cycle analysis.
0.1 J
L No me
D
I 0 AI (a=l) A2(a=l)
u 1 (In-phasc
0 Bl(e2)
0 Cl(at3)
a t 006
e
0.001 I I 0.001 I !(b)
1 o4 1 o5 1 o6 1 o4 1 o5 lo6
Number of blocks to failure Number of blocks to failure
0.1 I 4
No mean stress
B4 (0~2)
# 1 (Out-of-phase loading) (Out-of-phase loading) 8 c4 (a=3)
2 C3 (a=3)
8
a
a ; , , . , , , ,Ic) i
0.001 - ' ' 0.001
'
'
I o4 10' 1 o6 1 o4 I os IO6
Number of blocks to failure Number of blocks to failure
Fig. 8. Biaxial fatigue life correlation for various in-phase and out-phase histories and
frequency ratios.
Fig. 8 shows that the proposed fatigue parameter successfully correlates biaxial fatigue lives
of thin-walled EN24 steel tubular specimens tested under in-phase and out-of-phase biaxial
fatigue stressing where stresses were at different frequencies and included mean values. The
proposed parameter successfully correlates biaxial fatigue lives in low-cycle-fatigue regime