
Page 272 - Biaxial Multiaxial Fatigue and Fracture
P. 272
256 M. END0
-
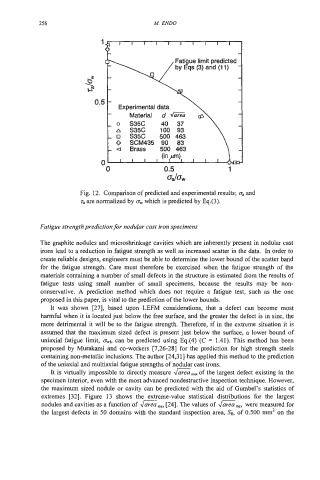
Fatigue limit predicted -
by Eqs (3) and (1 1)
s -
\
d - -
-
0.5
Experimental data
- 0 S35C 40 37
A s35c 100 93
- 0 S35C 500 463
0 SCM435 90 83
I l l
0 0.5 1
dav
Fig. 12. Comparison of predicted and experimental results; ca and
za are normalized by a, which is predicted by Eq.(3).
Fatigue strength prediction for nodular cast iron specimens
The graphite nodules and microshrinkage cavities which are inherently present in nodular cast
irons lead to a reduction in fatigue strength as well as increased scatter in the data. In order to
create reliable designs, engineers must be able to determine the lower bound of the scatter band
for the fatigue strength. Care must therefore be exercised when the fatigue strength of the
materials containing a number of small defects in the structure is estimated from the results of
fatigue tests using small number of small specimens, because the results may be non-
conservative. A prediction method which does not require a fatigue test, such as the one
proposed in this paper, is vital to the prediction of the lower bounds.
It was shown [27], based upon LEFM considerations, that a defect can become most
harmful when it is located just below the free surface, and the greater the defect is in size, the
more detrimental it will be to the fatigue strength. Therefore, if in the extreme situation it is
assumed that the maximum sized defect is present just below the surface, a lower bound of
uniaxial fatigue limit, awl, can be predicted using Eq.(4) (C = 1.41). This method has been
proposed by Murakami and co-workers [7,26-281 for the prediction for high strength steels
containing non-metallic inclusions. The author [24,3 1 J has applied this method to the prediction
of the uniaxial and multiaxial fatigue strengths of nodular cast irons.
It is virtually impossible to directly measure Gmaxof the largest defect existing in the
specimen interior, even with the most advanced nondestructive inspection technique. However,
the maximum sized nodule or cavity can be predicted with the aid of Gumbel’s statistics of
extremes [32]. Figure 13 shows the extreme-value statistical distributions for the largest
nodules and cavities as a function of &,, [24]. The values of &, were measured for
the largest defects in 50 domains with the standard inspection area, SO, of 0.500 mm2 on the