
Page 273 - Biaxial Multiaxial Fatigue and Fracture
P. 273
The Multiaxial Fatigue Strength of Specimens Containing Small Defects 257
transverse section of a specimen. According to the instructions of [7], the mean value of the
&, measured was taken as appropriate value of the thickness, t, of the 3D inspection
domain. Thus, the standard inspection volume, VO, was defined by t SO, and the expected value
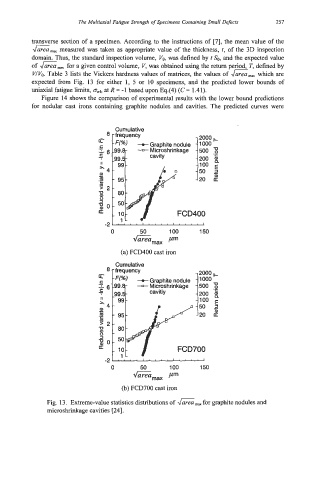
VWo. Table 3 lists the Vickers hardness values of matrices, the values of &,., which are
of G,, for a given control volume, V, was obtained using the retum period, T, defined by
expected from Fig. 13 for either 1, 5 or 10 specimens, and the predicted lower bounds of
uniaxial fatigue limits, -1, at R = -1 based upon Eq.(4) (C = 1.41).
Figure 14 shows the comparison of experimental results with the lower bound predictions
for nodular cast irons containing graphite nodules and cavities. The predicted curves were
Cumulative
0 50 100 150
=amax pm
(a) FCD400 cast iron
Cumulative
0 50 100 150
=amax pm
(b) FCD700 cast iron
Fig. 13. Extreme-value statistics distributions of G,, for graphite nodules and
microshrinkage cavities [24].