
Page 276 - Biaxial Multiaxial Fatigue and Fracture
P. 276
260 M. END0
The prediction for smooth specimens is given as the dashed curve in Fig. 9, based upon Eq.( 15).
It is now clear that when the defect is sufficiently small, the fatigue strength is determined by a
competition between the fatigue strengths of the smooth region of the specimen and that part
containing the hole. From the intersection of the predicted solid lines for the 40 pm and 100 pm
cases with the dashed curve, it appears that the critical size of a non-detrimental defect
increases with increase in the combined stress ratio, do.
In the case of nodular cast irons, as already mentioned above, the fatigue strength of smooth
specimens includes the contribution of the graphite nodules and the microshrinkage cavities
present in the structure, so that the fatigue limit of defect-free specimens for these irons cannot
be obtained in a fatigue test. In this case, the following empirical relation [7,26] is therefore
employed:
where od is in MPa and HV, the Vickers hardness, is in kgf/mm2. It can be considered that
Eq.(16) predicts the uniaxial fatigue limit of a defect-free specimen or of a specimen that
contains non-detrimental defects. For ductile metals of relatively low strength, the ratio of rWo
to aWo is about 0.6 [34,35], and Eq.( 15) is reduced to
The predictions based upon Eq.(17) are shown by dashed curves in Figs. 14a and 14b. Since the
solid curves for graphite nodules and microshrinkage cavities are lower than dashed curves for
defect-free specimens, it appears that nodules and cavities can act harmfully to lower the
fatigue strength under all combinations of aand T.
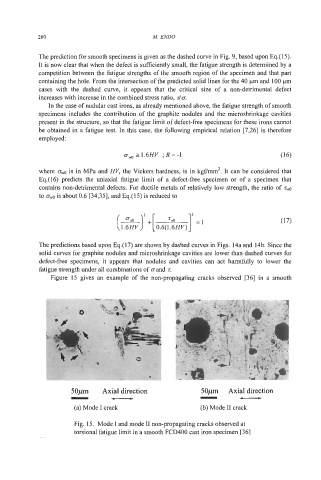
Figure 15 gives an example of the non-propagating cracks observed [36] in a smooth
- - - -
50pm Axial direction
50p Axial direction
(a) Mode I crack (b) Mode I1 crack
Fig. 15. Mode I and mode I1 non-propagating cracks observed at
torsional fatigue limit in a smooth FCD400 cast iron specimen [361