
Page 332 - Biaxial Multiaxial Fatigue and Fracture
P. 332
316 FJ LINO ET AL.
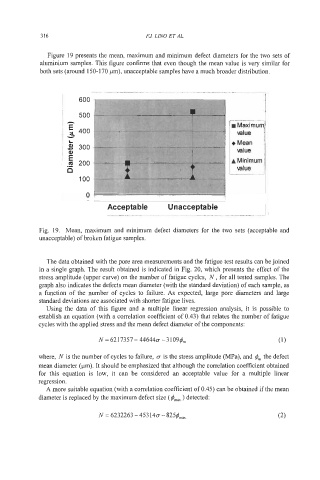
Figure 19 presents the mean, maximum and minimum defect diameters for the two sets of
aluminium samples. This figure confirms that even though the mean value is very similar for
both sets (around 150-170 pm), unacceptable samples have a much broader distribution.
600
~
i 500
I - w Maximun
1 5 400 value
Y
L + Mean
$! 300 value
A Minimum
value
I 100
0
Acceptable Unacceptable
Fig. 19. Mean, maximum and minimum defect diameters for the two sets (acceptable and
unacceptable) of broken fatigue samples.
The data obtained with the pore area measurements and the fatigue test results can be joined
in a single graph. The result obtained is indicated in Fig. 20, which presents the effect of the
stress amplitude (upper curve) on the number of fatigue cycles, N , for all tested samples. The
graph also indicates the defects mean diameter (with the standard deviation) of each sample, as
a function of the number of cycles to failure. As expected, large pore diameters and large
standard deviations are associated with shorter fatigue lives.
Using the data of this figure and a multiple linear regression analysis, it is possible to
establish an equation (with a correlation coefficient of 0.43) that relates the number of fatigue
cycles with the applied stress and the mean defect diameter of the components:
N ~6217357- 44644~-31094,,, (1)
where, N is the number of cycles to failure, D is the stress amplitude (MPa), and @,,, the defect
mean diameter (pm). It should be emphasized that although the correlation coefficient obtained
for this equation is low, it can be considered an acceptable value for a multiple linear
regression.
A more suitable equation (with a correlation coefficient of 0.45) can be obtained if the mean
diameter is replaced by the maximum defect size ( ) detected:
N = 6232263 - 453 14~ 825@,, (2)
-