
Page 330 - Biaxial Multiaxial Fatigue and Fracture
P. 330
3 14 FJ LINO ET AL.
Fig. 15. Fracture surface, a) the fracture surface presents regions of small deformation, b) some
deformation with large fragile plates between the aluminium.
Figures 17 and 18 present the area percentage of pores detected in the fracture surface
divided by the total planar fracture surface area (sample reference names are reported along the
x axis). As one can see, the pore surface area in the fracture surfaces of both sets of samples is
very similar, around 2.7% for the unacceptable samples and approximately 2.2% for acceptable
ones. These values are similar to the ones obtained in the cross sections of the pedals, which
were presented previously: 2.9% for unacceptable samples and 1.9% for acceptable samples.
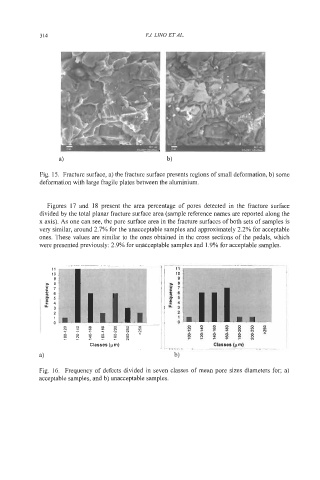
Fig. 16. Frequency of defects divided in seven classes of mean pore sizes diameters for; a)
acceptable samples, and b) unacceptable samples.