
Page 328 - Biaxial Multiaxial Fatigue and Fracture
P. 328
312 El LINO ET AL.
140
2 120
I P 100
'0
+J .-
3
E 80
E
60
u)
u)
$ 40
v)
20
I 0 100 ~~ - 1000 10000 ~ ~ __ 100000 1000000 10000000
Number of Cycles
~
~
~
~~~~~~~~
Fig. 1 1. Woehler curve for unacceptable samples.
As one can see, unacceptable samples have a much broader number of cycles-to-failure
distribution (correlation coefficient R2 equal to 0.25) for the high alternating stress regime,
which means that the defects (essentially micropores) have a considerable effect on fatigue life
reduction for high alternating stresses.
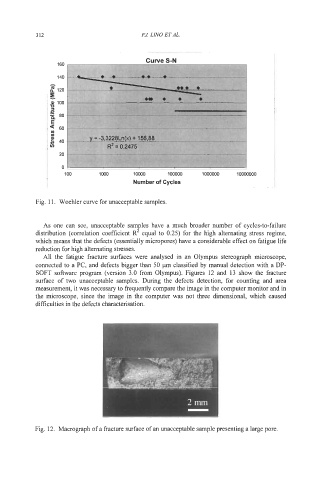
All the fatigue fracture surfaces were analysed in an Olympus stereograph microscope,
connected to a PC, and defects bigger than 50 pm classified by manual detection with a DP-
SOFT software program (version 3.0 from Olympus). Figures 12 and 13 show the fracture
surface of two unacceptable samples. During the defects detection, for counting and area
measurement, it was necessary to frequently compare the image in the computer monitor and in
the microscope, since the image in the computer was not three dimensional, which caused
difficulties in the defects characterisation.
Fig. 12. Macrograph of a fracture surface of an unacceptable sample presenting a large pore.