
Page 324 - Biaxial Multiaxial Fatigue and Fracture
P. 324
308 EL LINO ET AL.
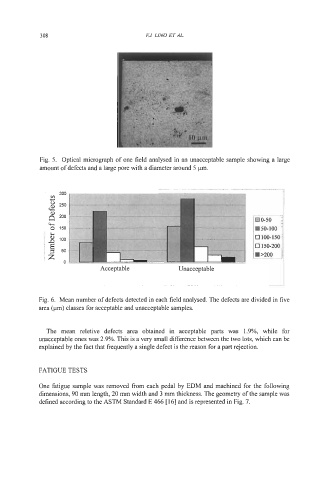
Fig. 5. Optical micrograph of one field analysed in an unacceptable sample showing a large
amount of defects and a large pore with a diameter around 5 pm.
-
-~
-
~~~--
--
~~
300
m
0-50
1 %
0 150 W50-100
0 100-150
0 150-200
W >200 _ _
_
~
I Acceptable Unacceptable
Fig. 6. Mean number of defects detected in each field analysed. The defects are divided in five
area (pm) classes for acceptable and unacceptable samples.
The mean reletive defects area obtained in acceptable parts was 1.9%, while for
unacceptable ones was 2.9%. This is a very small difference between the two lots, which can be
explained by the fact that frequently a single defect is the reason for a part rejection.
FATIGUE TESTS
One fatigue sample was removed from each pedal by EDM and machined for the following
dimensions, 90 mm length, 20 mm width and 3 mm thickness. The geometry of the sample was
defined according to the ASTM Standard E 466 [ 161 and is represented in Fig. 7.