
Page 327 - Biaxial Multiaxial Fatigue and Fracture
P. 327
Influence of Defects on Fatigue Life of Aluminium Pressure Diecastings 31 1
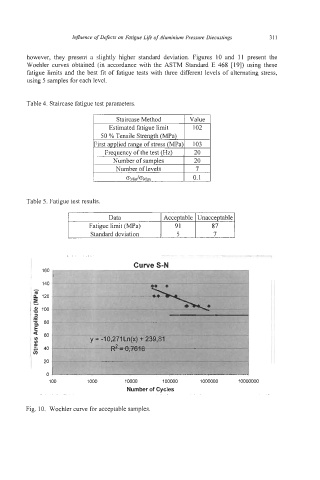
however, they present a slightly higher standard deviation. Figures 10 and 11 present the
Woehler curves obtained (in accordance with the ASTM Standard E 468 [19]) using these
fatigue limits and the best fit of fatigue tests with three different levels of alternating stress,
using 5 samples for each level.
Table 4. Staircase fatigue test parameters.
Staircase Method I Value
Estimated fatigue limit I 102
50 % Tensile Strength (MPa)
First applied range of stress (MPa) 103
Frequency of the test (Hz) 20
Number of samples 20
Number of levels 7
OMylidOMax 0.1
Table 5. Fatigue test results.
Data Acceptable Unacceptable
Fatigue limit (MPa) 91 87
Standard deviation 5 7
Curve S-N
160
-
140
2 120
k
4 100
*
3
E 80
E
a 60
u)
u)
2 40
cn
20
0
100 10000 100000 1000000 10000000
Number of Cycles
-~. ~- __
Fig. 10. Woehler curve for acceptable samples.