
Page 341 - Biaxial Multiaxial Fatigue and Fracture
P. 341
Variabiliy in Fatigue Lives: An Effect of the Elastic Anisotropy of Grains? 325
the same place of those at 356 MPa. If the specimen is loaded up to the yield stress (i.e. 850
MPa), the contrast is increased and particularly evident close to the surfaces. Though plastic
strain has occurred at 850 MPa, the shape of the patterns observed on the surface is not
significantly modified as compared with that observed at 356 MPa. (Note that the greyscale
levels does not reflect a modification of the strain distribution. The isochromatic fringes belong
all to the first order at 356 MPa, while they belong to two consecutive fringe orders at 850
MPa, which explains the reversion of the greyscale levels though the strain distribution is
similar).
It can be concluded from these experiments that the scale associated with the strain
heterogeneity in the TA6V titanium alloy is larger than the grain size, approaching 10 grains.
The following experiments have also been performed, to reveal a possible scale associated
with the heterogeneous distribution of strain in a different material. Thin sheets of OFHC
polycrystalline copper have been subjected at room temperature both to a monotonic tensile test
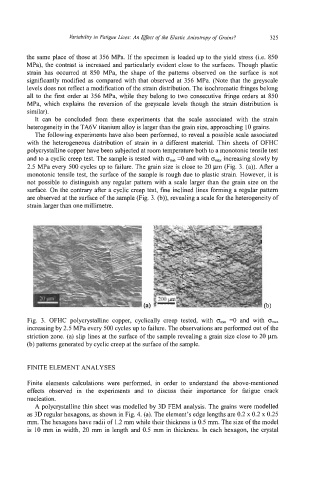
and to a cyclic creep test. The sample is tested with omin =O and with omX increasing slowly by
2.5 MPa every 500 cycles up to failure. The grain size is close to 20 pm (Fig. 3. (a)). After a
monotonic tensile test, the surface of the sample is rough due to plastic strain. However, it is
not possible to distinguish any regular pattern with a scale larger than the grain size on the
surface. On the contrary after a cyclic creep test, fine inclined lines forming a regular pattern
are observed at the surface of the sample (Fig. 3. (b)), revealing a scale for the heterogeneity of
strain larger than one millimetre.
Fig. 3. OFHC polycrystalline copper, cyclically creep tested, with om,, =O and with o,,
increasing by 2.5 MPa every 500 cycles up to failure. The observations are performed out of the
striction zone. (a) slip lines at the surface of the sample revealing a grain size close to 20 pm.
(b) patterns generated by cyclic creep at the surface of the sample.
FINITE ELEMENT ANALYSES
Finite elements calculations were performed, in order to understand the above-mentioned
effects observed in the experiments and to discuss their importance for fatigue crack
nucleation.
A polycrystalline thin sheet was modelled by 3D FEM analysis. The grains were modelled
as 3D regular hexagons, as shown in Fig. 4. (a). The element's edge lengths are 0.2 x 0.2 x 0.25
mm. The hexagons have radii of 1.2 mm while their thickness is 0.5 mm. The size of the model
is 10 mm in width, 20 mm in length and 0.5 mm in thickness. In each hexagon, the crystal