
Page 346 - Biaxial Multiaxial Fatigue and Fracture
P. 346
330 S. POMMIER
Quantitative evaluation of the importance of the load percolation network.
In order to quantify the importance of the formation of a load percolation network for the
fatigue crack nucleation process, the following calculations have been performed. A single
hexagon located at the centre of the thin sheet was set to have a fixed crystal orientation, while
the crystal orientations of the other hexagons in the model were randomly selected before each
calculation. Seventy computations have been performed. For each computation the maximum
principal stress component was determined at the centre of the grain for which the crystal
orientation is fixed. The distribution of this value was calculated for the above seventy random
configurations. This distribution is found to be a Gaussian. Therefore the distribution width is
calculated here, as three times the standard deviation divided by the mean value of the
distribution. The results of these computations are gathered in Table 2. The maximum principal
stress in aluminium is found to vary of +I- 7 % around the mean value. This variability is rather
low as compared with copper and zinc for which the variation is of +I- 35 %. The variability of
the maximum principal stress found for iron, is also very high, Le. +/- 25 %.
It was mentioned in the introduction that two conditions should be hlfilled to promote
fatigue crack nucleation. On the one hand, a “weak” grain should be heavily loaded and on the
other hand, its crystalline orientation should be favourable for slip. It is interesting, at first, to
check if one effect is of prime importance as compared with the other.
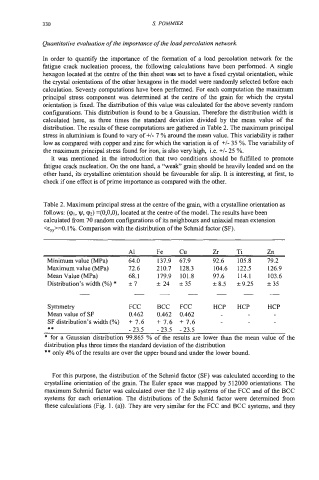
Table 2. Maximum principal stress at the centre of the grain, with a crystalline orientation as
follows: (91, w, (a~) =(O,O,O), located at the centre of the model. The results have been
calculated from 70 random configurations of its neighbours and uniaxial mean extension
-4.1%. Comparison with the distribution of the Schmid factor (SF).
A1 Fe Cu Zr Ti Zn
Minimum value (MPa) 64.0 137.9 67.9 92.6 105.8 79.2
Maximum value (MPa) 72.6 210.7 128.3 104.6 122.5 126.9
Mean Value (MPa) 68.1 179.9 101.8 97.6 114.1 103.6
Distribution’s width (%) * f 7 f 24 S35 k8.5 *9.25 *35
symmetry FCC BCC FCC HCP HCP HCP
Mean value of SF 0.462 0.462 0.462
SF distribution’s width (%) + 7.6 + 7.6 + 7.6
** -23.5 -23.5 -23.5
* for a Gaussian distribution 99.865 % of the results are lower than the mean value of the
distribution plus three times the standard deviation of the distribution
** only 4% of the results are over the upper bound and under the lower bound.
For this purpose, the distribution of the Schmid factor (SF) was calculated according to the
crystalline orientation of the grain. The Euler space was mapped by 512000 orientations. The
maximum Schmid factor was calculated over the 12 slip systems of the FCC and of the BCC
systems for each orientation. The distributions of the Schmid factor were determined from
these calculations (Fig. 1. (a)). They are very similar for the FCC and BCC systems, and they