
Page 351 - Biaxial Multiaxial Fatigue and Fracture
P. 351
Variability in Fatigue Lives: An Effect of the Elastic Anisotropy of Grains? 335
The statistic distributions of the Tresca equivalent stress calculated in shear and in tension
are plotted in Fig. 12. The scatter is larger for shear than for a uniaxial extension. About 7% of
the values obtained in shear are over the upper bounds obtained in uniaxial extension. Up to
150 calculations have been performed to build each distribution, in order to check that this
effect was not an artefact, and this is not, since it corresponds to 11 points.
This effect is interpreted as the effect of the intersections between the links of the load
percolation networks. As a matter of fact, in the intensity maps of the Tresca equivalent stress
(Fig. 1 1. (d)), the overstressed grains are always found at the intersections between the links of
the load percolation networks associated with each principal direction. Therefore, a few grains
at the intersections between the two links are heavily loaded, the grains located within the links
are moderately loaded, while those located out of the two loads percolation networks sustain
very low levels of the Tresca equivalent stress. In comparison, in uniaxial extension, the grains
are heavily loaded if they belong to the load percolation network and sustain low values of the
Tresca equivalent stress if they are out of the links. Consequently, there is an increase of the
scatter on the Tresca equivalent stress in shear as compared with uniaxial loading conditions.
\\
000
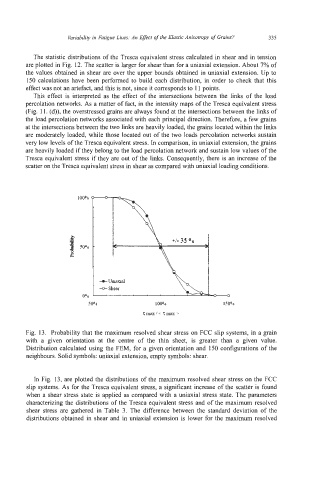
Fig. 13. Probability that the maximum resolved shear stress on FCC slip systems, in a grain
with a given orientation at the centre of the thin sheet, is greater than a given value.
Distribution calculated using the FEM, for a given orientation and 150 configurations of the
neighbours. Solid symbols: uniaxial extension, empty symbols: shear.
In Fig. 13, are plotted the distributions of the maximum resolved shear stress on the FCC
slip systems. As for the Tresca equivalent stress, a significant increase of the scatter is found
when a shear stress state is applied as compared with a uniaxial stress state. The parameters
characterizing the distributions of the Tresca equivalent stress and of the maximum resolved
shear stress are gathered in Table 3. The difference between the standard deviation of the
distributions obtained in shear and in uniaxial extension is lower for the maximum resolved