
Page 347 - Biaxial Multiaxial Fatigue and Fracture
P. 347
Variabili@ in Fatigue Lives: An Effect of the Elastic Anisotropy of Grains? 33 1
are not centred on their mean value. Low values of the maximum Schmid factor are not
excluded, but their probability is very small. The mean value of the Schmid factor is found to
be high (<SF>=0.462). Therefore, in grains for which the Schmid factor is at its maximum
(SF=0.5), the Schmid factor is only 8% higher than the mean Schmid factor in the polycrystal.
In copper, for a given crystalline orientation of the grain, the maximum principal stress can
be higher by 35 YO than the mean value in the polycrystal, according to the configuration of its
neighbours. In comparison, for a given stress state in the grain, the resolved shear stress can be
higher by only 8 % than the mean value in the polycrystal, according to the crystalline
orientation of the grain. Therefore, in iron and copper, the load percolation network should be
dominant, in the crack nucleation process, as compared with the effect of the crystalline
orientation of the grains. In aluminium, the two effects appear to be of the same magnitude
(Table 2).
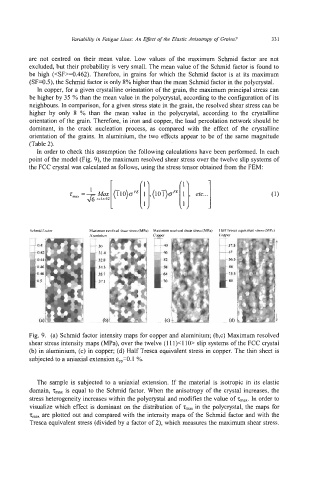
In order to check this assumption the following calculations have been performed. In each
point of the model (Fig. 9), the maximum resolved shear stress over the twelve slip systems of
the FCC crystal was calculated as follows, using the stress tensor obtained from the FEM:
Aluminium Copper
30 A 40 37 5
31 4 47
32 8 56 5
34 3 66
35 7 64 75 5
37 1 70 85
Fig. 9. (a) Schmid factor intensity maps for copper and aluminium; (b,c) Maximum resolved
shear stress intensity maps (MPa), over the twelve (1 11)4 10> slip systems of the FCC crystai
(b) in aluminium, (c) in copper; (d) Half Tresca equivalent stress in copper. The thin sheet is
subjected to a uniaxial extension E+O. 1 %.
The sample is subjected to a uniaxial extension. If the material is isotropic in its elastic
domain, T,,, is equal to the Schmid factor. When the anisotropy of the crystal increases, the
stress heterogeneity increases within the polycrystal and modifies the value of T,,,. In order to
visualize which effect is dominant on the distribution of z,,, in the polycrystal, the maps for
zmax are plotted out and compared with the intensity maps of the Schmid factor and with the
Tresca equivalent stress (divided by a factor of 2), which measures the maximum shear stress.