
Page 344 - Biaxial Multiaxial Fatigue and Fracture
P. 344
328 S. POMMIER
In Fig. 6 are displayed iso-contours of the maximum principal strain component in copper
for the same model, with the same set of orientations in uniaxial extension, shear and biaxial
extension. As in Fig. 5, though the crystalline orientations of grains were defined to be random,
the spatial distribution of strain in the model is not random. However, the patterns observed for
the strain are different from those observed for the stress. There is roughly a rotation of 45"
between the links of the maximum principal stress network and that of the maximum principal
strain network. In uniaxial extension for example, the intensity of maximum principal strain is
higher within links inclined of about 45" with the y axis, though the maximum principal strain
direction is roughly aligned with the y axis. This result is consistent with the experimental
observations on TA6V (Fig. 2).
Aluminium Irun
-...
I
Zinc:
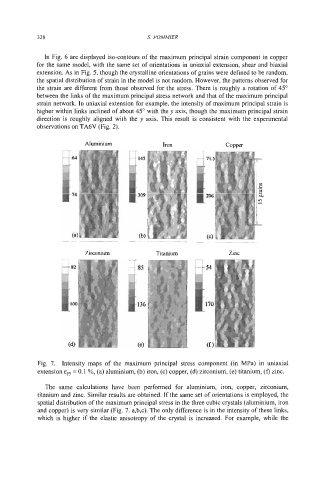
Fig. 7. Intensity maps of the maximum principal stress component (in MPa) in uniaxial
extension E~ = 0.1 %, (a) aluminium, (b) iron, (c) copper, (d) zirconium, (e) titanium, (f) zinc.
The same calculations have been performed for aluminium, iron, copper, zirconium,
titanium and zinc. Similar results are obtained. If the same set of orientations is employed, the
spatial distribution of the maximum principal stress in the three cubic crystals (aluminium, iron
and copper) is very similar (Fig. 7. a,b,c). The only difference is in the intensity of these links,
which is higher if the elastic anisotropy of the crystal is increased. For example, while the