
Page 348 - Biaxial Multiaxial Fatigue and Fracture
P. 348
332 S. POMMIER
This map is plotted for copper only, since the spatial distribution of the Tresca equivalent stress
is very similar in aluminium, except that the intensity of the links is much lower.
It is obvious from Fig. 9, that in aluminium T,,, is mostly dominated by the crystalline
orientation of the grain, while in copper, z,,, is mostly determined by the location of the grain
with respect to the load percolation network.
Aluminium Iron
33.1
80.5
Zirconium Titanium zinc
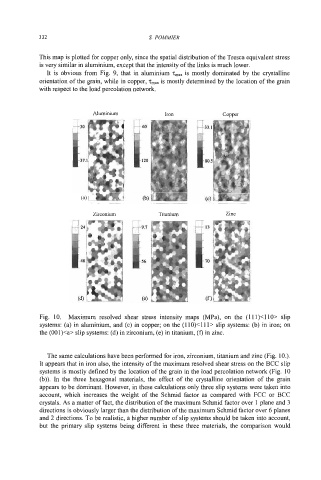
Fig. 10. Maximum resolved shear stress intensity maps (MPa), on the (111)<110> slip
systems: (a) in aluminium, and (c) in copper; on the (1 10)<1 11> slip systems: (b) in iron; on
the (OOl)<a> slip systems: (d) in zirconium, (e) in titanium, (0 in zinc.
The same calculations have been performed for iron, zirconium, titanium and zinc (Fig. 10.).
It appears that in iron also, the intensity of the maximum resolved shear stress on the BCC slip
systems is mostly defined by the location of the grain in the load percolation network (Fig. 10
(b)). In the three hexagonal materials, the effect of the crystalline orientation of the grain
appears to be dominant. However, in these calculations only three slip systems were taken into
account, which increases the weight of the Schmid factor as compared with FCC or BCC
crystals. As a matter of fact, the distribution of the maximum Schmid factor over 1 plane and 3
directions is obviously larger than the distribution of the maximum Schmid factor over 6 planes
and 2 directions. To be realistic, a higher number of slip systems should be taken into account,
but the primary slip systems being different in these three materials, the comparison would