
Page 350 - Biaxial Multiaxial Fatigue and Fracture
P. 350
334 S. POMMIER
principal stress component around their mean values. This dispersion reaches +/- 35% in
copper under uniaxial loading conditions. If a biaxial stress state is applied on a sample, with a
mean value of the Tresca equivalent stress equal to that applied under uniaxial conditions (Eq.
(2)), does it mean that the dispersion around this mean value (Eq. (3)) is also the same? There
is no reason to consider that the load percolation networks associated with each direction are
uncorrelated. In such a case, the dispersion of the difference between the maximum and the
minimum principal stress components is not the sum of the dispersions for each component.
The same problem occurs for determining the dispersion on the maximum resolved shear stress
on slip systems.
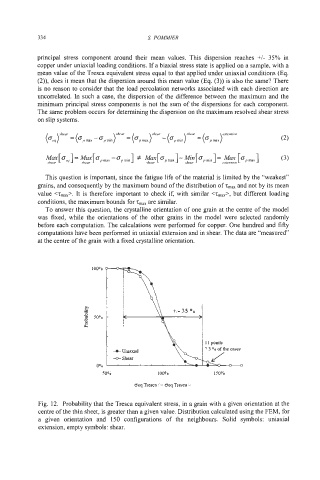
This question is important, since the fatigue life of the material is limited by the "weakest"
grains, and consequently by the maximum bound of the distribution of z,,, and not by its mean
value <zmax>. It is therefore important to check if, with similar <zmax>, but different loading
conditions, the maximum bounds for z,,, are similar.
To answer this question, the crystalline orientation of one grain at the centre of the model
was fixed, while the orientations of the other grains in the model were selected randomly
before each computation. The calculations were performed for copper. One hundred and fifty
computations have been performed in uniaxial extension and in shear. The data are "measured"
at the centre of the grain with a fixed crystalline orientation.
IOOQO
IOOQO 15000
ueq Ttexca .C ueq Ttesca
Fig. 12. Probability that the Tresca equivalent stress, in a grain with a given orientation at the
centre of the thin sheet, is greater than a given value. Distribution calculated using the FEM, for
a given orientation and 150 configurations of the neighbours. Solid symbols: uniaxial
extension, empty symbols: shear.