
Page 349 - Biaxial Multiaxial Fatigue and Fracture
P. 349
Vnriability in Fatigue Lives: An Effect of the Elastic Anisotropy of Grains? 333
become difficult. One family of slip systems (the basal one) was therefore chosen arbitrarily for
this comparison. Nevertheless, it appears that, even if only three slip systems are considered,
the effect of the load percolation network is not negligible in zinc.
It can be concluded from these results, that the importance for fatigue crack nucleation of
the formation of a load percolation network through the polycrystal depends on the elastic
anisotropy of the material on the one hand, and on the number of primary slip systems, on the
other hand. If the number of primary slip systems and the elastic anisotropy of grains are high,
the nucleation process should be dominated by the self-organisation of the stress and strain
heterogeneity within the polycrystal. On the contrary, if the number of primary slip system and
the elastic anisotropy of grains are low, the nucleation process should be dominated by the
crystalline orientation of grains.
Multiaxial fatigue.
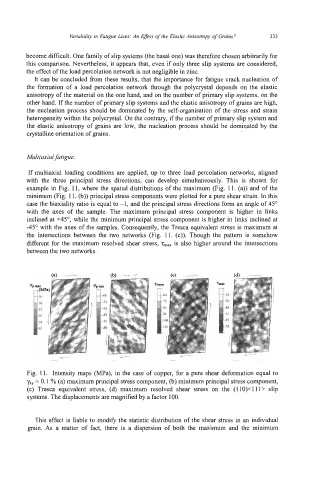
If multiaxial loading conditions are applied, up to three load percolation networks, aligned
with the three principal stress directions, can develop simultaneously. This is shown for
example in Fig. 1 1, where the spatial distributions of the maximum (Fig. 11. (a)) and of the
minimum (Fig. 1 1. (b)) principal stress components were plotted for a pure shear strain. In this
case the biaxiality ratio is equal to -1, and the principal stress directions form an angle of 45"
with the axes of the sample. The maximum principal stress component is higher in links
inclined at +45", while the minimum principal stress component is higher in links inclined at
-45" with the axes of the samples. Consequently, the Tresca equivalent stress is maximum at
the intersections between the two networks (Fig. 11. (c)). Though the pattern is somehow
different for the maximum resolved shear stress, z,, is also higher around the intersections
between the two networks.
Fig. 11. Intensity maps (MPa), in the case of copper, for a pure shear deformation equal to
yxy = 0.1 % (a) maximum principal stress component, (b) minimum principal stress component,
(c) Tresca equivalent stress, (d) maximum resolved shear stress on the (1 10)4 11> slip
systems. The displacements are magnified by a factor 100.
This effect is liable to modify the statistic distribution of the shear stress in an individual
grain. As a matter of fact, there is a dispersion of both the maximum and the minimum