
Page 353 - Biaxial Multiaxial Fatigue and Fracture
P. 353
Variability in Fatigue Lives: An Effect of the Elastic Anisotropy of Grains? 337
comparable, the probabilities for high values of T~~ should be higher under in-phase as
compared with out-of-phase multiaxial loading conditions.
In the second place, the spatial distribution of damage at the surface of the material should
be different, if turning loads are applied as compared with cyclic loads with a constant
direction. As a matter of fact, if damage appears in grains with a high level of z,,,,,, under
uniaxial loading conditions micro-cracks should appear within the links of the load percolation
network. It was shown above, that the links of the load percolation network are aligned with the
principal stress directions. Therefore if the maximum principal stress direction is turning, the
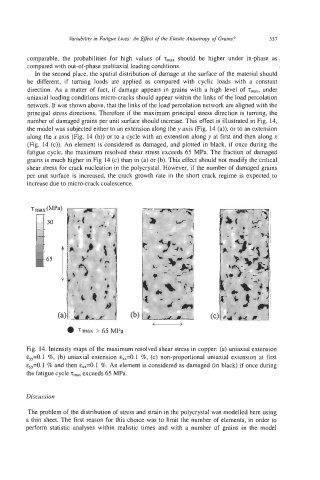
number of damaged grains per unit surface should increase. This effect is illustrated in Fig. 14,
the model was subjected either to an extension along the y axis (Fig. 14 (a)), or to an extension
along the x axis (Fig. 14 (b)) or to a cycle with an extension along y at first and then along x
(Fig. 14 (c)). An element is considered as damaged, and plotted in black, if once during the
fatigue cycle, the maximum resolved shear stress exceeds 65 MPa. The fraction of damaged
grains is much higher in Fig 14 (c) than in (a) or (b). This effect should not modify the critical
shear stress for crack nucleation in the polycrystal. However, if the number of damaged grains
per unit surface is increased, the crack growth rate in the short crack regime is expected to
increase due to micro-crack coalescence.
I
i,
I
I,
Fig. 14. Intensity maps of the maximum resolved shear stress in copper: (a) uniaxial extension
~,=0.1 %, (b) uniaxial extension &,,=0.1 %, (c) non-proportional uniaxial extension at first
eyy=O.l % and then ~,,=0.1 %. An element is considered as damaged (in black) if once during
the fatigue cycle T,,,~, exceeds 65 MPa.
Discussion
The problem of the distribution of stress and strain in the polycrystal was modelled here using
a thin sheet. The first reason for this choice was to limit the number of elements, in order to
perform statistic analyses within realistic times and with a number of grains in the model