
Page 342 - Biaxial Multiaxial Fatigue and Fracture
P. 342
326 S. POMMIER
orientation is set to be constant. The boundary conditions consist in imposed displacements.
For example, in uniaxial extension, a displacement of the upper side of the model is applied so
that the mean strain in the model is <~n>=O.l%, the bottom side is fixed and the other sides are
free. As the problem is fully linear elastic this choice is arbitrary. The elastic constants of the
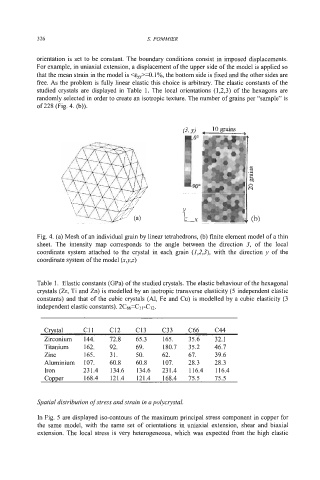
studied crystals are displayed in Table 1. The local orientations (1,2,3) of the hexagons are
randomly selected in order to create an isotropic texture. The number of grains per “sample” is
of 228 (Fig. 4. (b)).
Fig. 4. (a) Mesh of an individual grain by linear tetrahedrons, (b) finite element model of a thin
sheet. The intensity map corresponds to the angle between the direction 3, of the local
coordinate system attached to the crystal in each grain (1,2,3), with the direction y of the
coordinate system of the model (x,y,z)
Table I. Elastic constants (GPa) of the studied crystals. The elastic behaviour of the hexagonal
crystals (Zr, Ti and Zn) is modelled by an isotropic transverse elasticity (5 independent elastic
constants) and that of the cubic crystals (Al, Fe and Cu) is modelled by a cubic elasticity (3
independent elastic constants). 2c66=cl I-CI~.
Crystal C11 C12 C13 C33 C66 C44
Zirconium 144. 72.8 65.3 165. 35.6 32.1
Titanium 162. 92. 69. 180.7 35.2 46.7
Zinc 165. 31. 50. 62. 67. 39.6
Aluminium 107. 60.8 60.8 107. 28.3 28.3
Iron 231.4 134.6 134.6 231.4 116.4 116.4
Copper 168.4 121.4 121.4 168.4 75.5 75.5
Spatial distribution of stress and strain in a polycrystal.
In Fig. 5 are displayed iso-contours of the maximum principal stress component in copper for
the same model, with the same set of orientations in uniaxial extension, shear and biaxial
extension. The local stress is very heterogeneous, which was expected from the high elastic