
Page 388 - Biaxial Multiaxial Fatigue and Fracture
P. 388
3 72 M. FQNTE ET AL
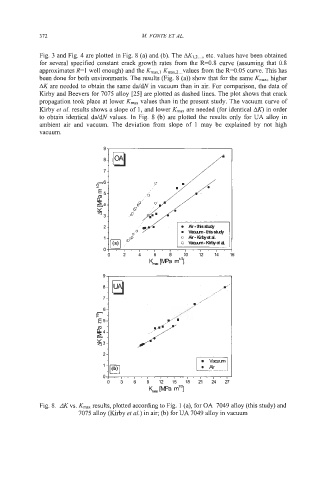
Fig. 3 and Fig. 4 are plotted in Fig. 8 (a) and (b). The AK~J etc. values have been obtained
...,
for several specified constant crack growth rates from the R=0.8 curve (assuming that 0.8
approximates R=l well enough) and the Kmax,l K-,z ... values from the R=0.05 curve. This has
been done for both environments. The results (Fig. 8 (a)) show that for the same K-, higher
AK are needed to obtain the same dddN in vacuum than in air. For comparison, the data of
Kirby and Beevers for 7075 alloy [25] are plotted as dashed lines. The plot shows that crack
propagation took place at lower K,, values than in the present study. The vacuum curve of
Kirby et al. results shows a slope of 1, and lower K,, are needed (for identical AK) in order
to obtain identical dddN values. In Fig. 8 (b) are plotted the results only for UA alloy in
ambient air and vacuum. The deviation from slope of 1 may be explained by not high
vacuum.
9
6
7
F6
€5
g4
53
2
1
0
0 2 4 6 8 101214 6
L[Npa mls
9
7
6
F
E5
2-
1pJ /.Vacuum1
I
1. Air
0,. 1 . a . 1 , b , I , i . I, I
0 3 6 9 121516212427
L[Mpa mls
Fig. 8. dK vs. K,, results, plotted according to Fig. 1 (a), for OA 7049 alloy (this study) and
7075 alloy (Kirby et al.) in air; (b) for UA 7049 alloy in vacuum