
Page 430 - Biaxial Multiaxial Fatigue and Fracture
P. 430
414 K AUBIN, I! QUAEGEBEUR AND S. DEGALLALY
a (MPa)
450 1
400
350 )R+k
300
250
Ix-IIII - 1"'quadrant
50
0 50 100 150
Number of cycles
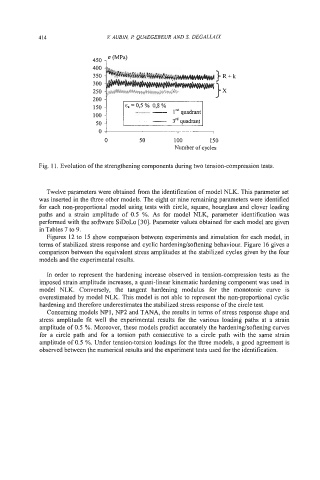
Fig. 1 1. Evolution of the strengthening components during two tension-compression tests.
Twelve parameters were obtained from the identification of model NLK. This parameter set
was inserted in the three other models. The eight or nine remaining parameters were identified
for each non-proportional model using tests with circle, square, hourglass and clover loading
paths and a strain amplitude of 0.5 %. As for model NLK, parameter identification was
performed with the software SiDoLo [30]. Parameter values obtained for each model are given
in Tables 7 to 9.
Figures 12 to 15 show comparison between experiments and simulation for each model, in
terms of stabilized stress response and cyclic hardeningkoftening behaviour. Figure 16 gives a
comparison between the equivalent stress amplitudes at the stabilized cycles given by the four
models and the experimental results.
In order to represent the hardening increase observed in tension-compression tests as the
imposed strain amplitude increases, a quasi-linear kinematic hardening component was used in
model NLK. Conversely, the tangent hardening modulus for the monotonic curve is
overestimated by model NLK. This model is not able to represent the non-proportional cyclic
hardening and therefore underestimates the stabilized stress response of the circle test.
Concerning models NP 1, NP2 and TANA, the results in terms of stress response shape and
stress amplitude fit well the experimental results for the various loading paths at a strain
amplitude of 0.5 %. Moreover, these models predict accurately the hardeningkoftening curves
for a circle path and for a torsion path consecutive to a circle path with the same strain
amplitude of 0.5 %. Under tension-torsion loadings for the three models, a good agreement is
observed between the numerical results and the experiment tests used for the identification.