
Page 116 - Big Data Analytics for Intelligent Healthcare Management
P. 116
5.8 RESULTS, INTERPRETATION AND DISCUSSION 109
Period
Techniques, period
EMGa, BaseLine
7 7.074 EMGa, 1 month
Subjects: 27
6.000 EMGa, 3 months
Subjects: 27 EMGa, 6 months
6 EMGa, 12 months
5.320
Subjects: 25 GSRa, BaseLine
5.423 GSRa, 1 month
5
Subjects: 26 GSRa, 3 months
5.115 Subjects: 23 GSRa, 6 months
4.087
Subjects: 26
Avg. frequency 4 Subjects: 24 3.720 Subjects: 23 GSRa, 12 months
3.792
2.913
Subjects: 25
3
2.714
Subjects: 21
2
1
0
BaseLine 1 month 3 months 6 months 12 months
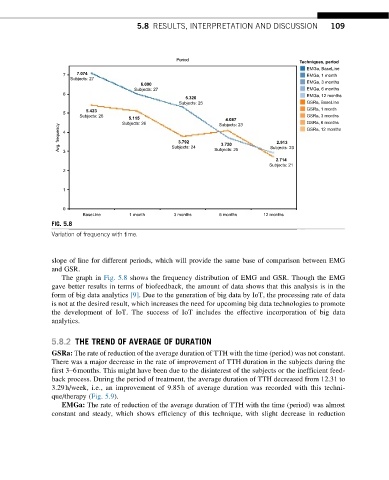
FIG. 5.8
Variation of frequency with time.
slope of line for different periods, which will provide the same base of comparison between EMG
and GSR.
The graph in Fig. 5.8 shows the frequency distribution of EMG and GSR. Though the EMG
gave better results in terms of biofeedback, the amount of data shows that this analysis is in the
form of big data analytics [9]. Due to the generation of big data by IoT, the processing rate of data
is not at the desired result, which increases the need for upcoming big data technologies to promote
the development of IoT. The success of IoT includes the effective incorporation of big data
analytics.
5.8.2 THE TREND OF AVERAGE OF DURATION
GSRa: The rate of reduction of the average duration of TTH with the time (period) was not constant.
There was a major decrease in the rate of improvement of TTH duration in the subjects during the
first 3–6months. This might have been due to the disinterest of the subjects or the inefficient feed-
back process. During the period of treatment, the average duration of TTH decreased from 12.31 to
3.29h/week, i.e., an improvement of 9.85h of average duration was recorded with this techni-
que/therapy (Fig. 5.9).
EMGa: The rate of reduction of the average duration of TTH with the time (period) was almost
constant and steady, which shows efficiency of this technique, with slight decrease in reduction