
Page 118 - Big Data Analytics for Intelligent Healthcare Management
P. 118
5.8 RESULTS, INTERPRETATION AND DISCUSSION 111
Period Techniques, period
7 EMGa, BaseLine
6.852 EMGa, 1 month
Subjects: 27
5.704 EMGa, 3 months
6 Subjects: 27 EMGa, 6 months
5.923
Subjects: 26 EMGa, 12 months
GSRa, BaseLine
5
GSRa, 1 month
3.917 GSRa, 3 months
Avg. intensity Subjects: 26 Subjects: 25 Subjects: 25 GSRa, 12 months
4.423
Subjects: 24
GSRa, 6 months
4
3.080
3.640
3
2.238
2.739 Subjects: 21
2 Subjects: 23
1.913
Subjects: 23
1
0
BaseLine 1 month 3 months 6 months 12 months
FIG. 5.10
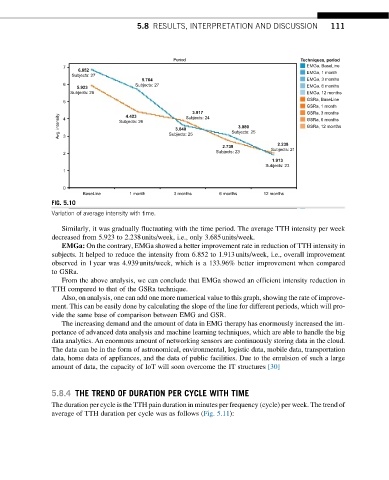
Variation of average intensity with time.
Similarly, it was gradually fluctuating with the time period. The average TTH intensity per week
decreased from 5.923 to 2.238units/week, i.e., only 3.685units/week.
EMGa: On the contrary, EMGa showed a better improvement rate in reduction of TTH intensity in
subjects. It helped to reduce the intensity from 6.852 to 1.913units/week, i.e., overall improvement
observed in 1year was 4.939units/week, which is a 133.96% better improvement when compared
to GSRa.
From the above analysis, we can conclude that EMGa showed an efficient intensity reduction in
TTH compared to that of the GSRa technique.
Also, on analysis, one can add one more numerical value to this graph, showing the rate of improve-
ment. This can be easily done by calculating the slope of the line for different periods, which will pro-
vide the same base of comparison between EMG and GSR.
The increasing demand and the amount of data in EMG therapy has enormously increased the im-
portance of advanced data analysis and machine learning techniques, which are able to handle the big
data analytics. An enormous amount of networking sensors are continuously storing data in the cloud.
The data can be in the form of astronomical, environmental, logistic data, mobile data, transportation
data, home data of appliances, and the data of public facilities. Due to the emulsion of such a large
amount of data, the capacity of IoT will soon overcome the IT structures [30]
5.8.4 THE TREND OF DURATION PER CYCLE WITH TIME
The duration per cycle is the TTH pain duration in minutes per frequency (cycle) per week. The trend of
average of TTH duration per cycle was as follows (Fig. 5.11):