
Page 123 - Big Data Analytics for Intelligent Healthcare Management
P. 123
116 CHAPTER 5 CHRONIC TTH ANALYSIS BY EMG AND GSR BIOFEEDBACK
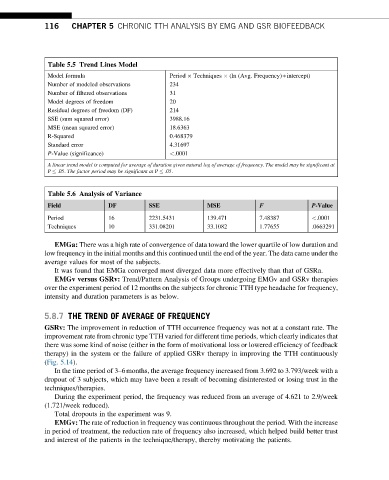
Table 5.5 Trend Lines Model
Model formula Period Techniques (ln (Avg. Frequency)+intercept)
Number of modeled observations 234
Number of filtered observations 31
Model degrees of freedom 20
Residual degrees of freedom (DF) 214
SSE (sum squared error) 3988.16
MSE (mean squared error) 18.6363
R-Squared 0.468379
Standard error 4.31697
P-Value (significance) <.0001
A linear trend model is computed for average of duration given natural log of average of frequency. The model may be significant at
P .05. The factor period may be significant at P .05.
Table 5.6 Analysis of Variance
F
Field DF SSE MSE P-Value
Period 16 2231.5431 139.471 7.48387 <.0001
Techniques 10 331.08201 33.1082 1.77655 .0663291
EMGa: There was a high rate of convergence of data toward the lower quartile of low duration and
low frequency in the initial months and this continued until the end of the year. The data came under the
average values for most of the subjects.
It was found that EMGa converged most diverged data more effectively than that of GSRa.
EMGv versus GSRv: Trend/Pattern Analysis of Groups undergoing EMGv and GSRv therapies
over the experiment period of 12 months on the subjects for chronic TTH type headache for frequency,
intensity and duration parameters is as below.
5.8.7 THE TREND OF AVERAGE OF FREQUENCY
GSRv: The improvement in reduction of TTH occurrence frequency was not at a constant rate. The
improvement rate from chronic type TTH varied for different time periods, which clearly indicates that
there was some kind of noise (either in the form of motivational loss or lowered efficiency of feedback
therapy) in the system or the failure of applied GSRv therapy in improving the TTH continuously
(Fig. 5.14).
In the time period of 3–6months, the average frequency increased from 3.692 to 3.793/week with a
dropout of 3 subjects, which may have been a result of becoming disinterested or losing trust in the
techniques/therapies.
During the experiment period, the frequency was reduced from an average of 4.621 to 2.9/week
(1.721/week reduced).
Total dropouts in the experiment was 9.
EMGv: The rate of reduction in frequency was continuous throughout the period. With the increase
in period of treatment, the reduction rate of frequency also increased, which helped build better trust
and interest of the patients in the technique/therapy, thereby motivating the patients.