
Page 127 - Big Data Analytics for Intelligent Healthcare Management
P. 127
120 CHAPTER 5 CHRONIC TTH ANALYSIS BY EMG AND GSR BIOFEEDBACK
observed in 1year was 5.036units/week, which was around 109.88% better improvement when com-
pared to GSRv. From the above analysis, we can conclude that EMGv showed more efficient intensity
reduction in TTH of subjects than that of GSRv therapy. EMG treatment had 8 dropouts and GSR
treatment had 9 dropouts.
Also, on analysis, one can add one more numerical value to this graph, showing the rate of improve-
ment. This can be easily done by calculating the slope of the line for different periods, which will
provide the same base of comparison between EMGv and GSRv.
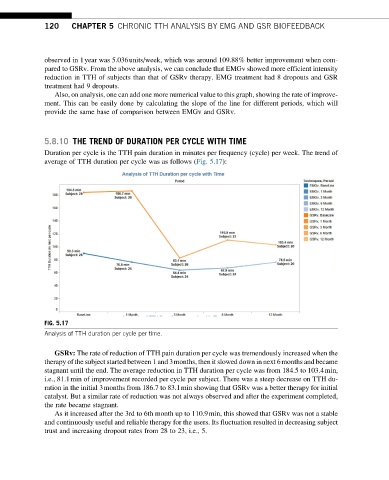
5.8.10 THE TREND OF DURATION PER CYCLE WITH TIME
Duration per cycle is the TTH pain duration in minutes per frequency (cycle) per week. The trend of
average of TTH duration per cycle was as follows (Fig. 5.17):
FIG. 5.17
Analysis of TTH duration per cycle per time.
GSRv: The rate of reduction of TTH pain duration per cycle was tremendously increased when the
therapy of the subject started between 1 and 3months, then it slowed down in next 6months and became
stagnant until the end. The average reduction in TTH duration per cycle was from 184.5 to 103.4min,
i.e., 81.1min of improvement recorded per cycle per subject. There was a steep decrease on TTH du-
ration in the initial 3months from 186.7 to 83.1min showing that GSRv was a better therapy for initial
catalyst. But a similar rate of reduction was not always observed and after the experiment completed,
the rate became stagnant.
As it increased after the 3rd to 6th month up to 110.9min, this showed that GSRv was not a stable
and continuously useful and reliable therapy for the users. Its fluctuation resulted in decreasing subject
trust and increasing dropout rates from 28 to 23, i.e., 5.