
Page 130 - Big Data Analytics for Intelligent Healthcare Management
P. 130
5.8 RESULTS, INTERPRETATION AND DISCUSSION 123
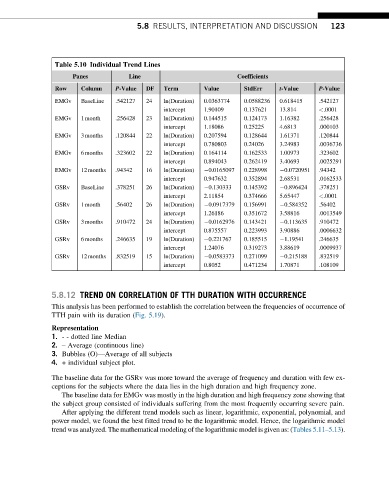
Table 5.10 Individual Trend Lines
Panes Line Coefficients
Row Column P-Value DF Term Value StdErr t-Value P-Value
EMGv BaseLine .542127 24 ln(Duration) 0.0363774 0.0588236 0.618415 .542127
intercept 1.90109 0.137621 13.814 <.0001
EMGv 1month .256428 23 ln(Duration) 0.144515 0.124173 1.16382 .256428
intercept 1.18086 0.25225 4.6813 .000103
EMGv 3months .120844 22 ln(Duration) 0.207594 0.128644 1.61371 .120844
intercept 0.780803 0.24026 3.24983 .0036736
EMGv 6months .323602 22 ln(Duration) 0.164114 0.162533 1.00973 .323602
intercept 0.894043 0.262419 3.40693 .0025291
EMGv 12months .94342 16 ln(Duration) 0.0165097 0.228998 0.0720951 .94342
intercept 0.947632 0.352894 2.68531 .0162533
GSRv BaseLine .378251 26 ln(Duration) 0.130333 0.145392 0.896424 .378251
intercept 2.11854 0.374666 5.65447 <.0001
GSRv 1month .56402 26 ln(Duration) 0.0917379 0.156991 0.584352 .56402
intercept 1.26186 0.351672 3.58816 .0013549
GSRv 3months .910472 24 ln(Duration) 0.0162976 0.143421 0.113635 .910472
intercept 0.875557 0.223993 3.90886 .0006632
GSRv 6months .246635 19 ln(Duration) 0.221767 0.185515 1.19541 .246635
intercept 1.24076 0.319273 3.88619 .0009937
GSRv 12months .832519 15 ln(Duration) 0.0583373 0.271099 0.215188 .832519
intercept 0.8052 0.471234 1.70871 .108109
5.8.12 TREND ON CORRELATION OF TTH DURATION WITH OCCURRENCE
This analysis has been performed to establish the correlation between the frequencies of occurrence of
TTH pain with its duration (Fig. 5.19).
Representation
1. - - dotted line Median
2. – Average (continuous line)
3. Bubbles (O)—Average of all subjects
4. + individual subject plot.
The baseline data for the GSRv was more toward the average of frequency and duration with few ex-
ceptions for the subjects where the data lies in the high duration and high frequency zone.
The baseline data for EMGv was mostly in the high duration and high frequency zone showing that
the subject group consisted of individuals suffering from the most frequently occurring severe pain.
After applying the different trend models such as linear, logarithmic, exponential, polynomial, and
power model, we found the best fitted trend to be the logarithmic model. Hence, the logarithmic model
trend was analyzed. The mathematical modeling of the logarithmic model is given as: (Tables 5.11–5.13).