
Page 133 - Big Data Analytics for Intelligent Healthcare Management
P. 133
126 CHAPTER 5 CHRONIC TTH ANALYSIS BY EMG AND GSR BIOFEEDBACK
GSRv: After applying the therapies, the data started moving toward the quartile of low duration and
low frequency. This trend continued and at the end of the year, the majority of data came under the zone
of low frequency and low duration with the exceptions of four subjects.
EMGv: There was high rate of convergence of data toward the lower quartile of low duration and
low frequency in the initial months and this continued until the end of the year. The data came under the
average values for most of the subjects.
It was found that EMGv converged most diverged data more effectively than that of GSRv.
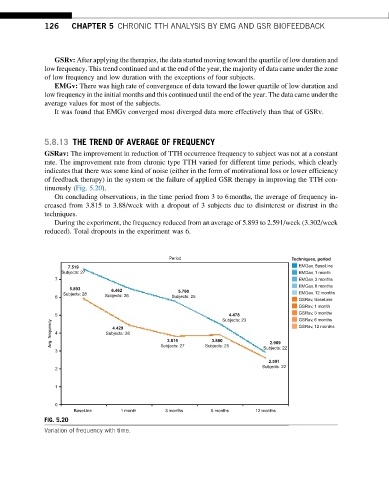
5.8.13 THE TREND OF AVERAGE OF FREQUENCY
GSRav: The improvement in reduction of TTH occurrence frequency to subject was not at a constant
rate. The improvement rate from chronic type TTH varied for different time periods, which clearly
indicates that there was some kind of noise (either in the form of motivational loss or lower efficiency
of feedback therapy) in the system or the failure of applied GSR therapy in improving the TTH con-
tinuously (Fig. 5.20).
On concluding observations, in the time period from 3 to 6months, the average of frequency in-
creased from 3.815 to 3.88/week with a dropout of 3 subjects due to disinterest or distrust in the
techniques.
During the experiment, the frequency reduced from an average of 5.893 to 2.591/week (3.302/week
reduced). Total dropouts in the experiment was 6.
Period Techniques, period
7.519 EMGav, BaseLine
Subjects: 27 EMGav, 1 month
7 EMGav, 3 months
EMGav, 6 months
5.893 6.462 5.760
Subjects: 28 EMGav, 12 months
6 Subjects: 26 Subjects: 25
GSRav, BaseLine
GSRav, 1 month
GSRav, 3 months
5 Subjects: 23 GSRav, 6 months
4.478
Avg. frequency 4 Subjects: 28 3.815 3.880 2.909 GSRav, 12 months
4.429
3 Subjects: 27 Subjects: 25 Subjects: 22
2.591
Subjects: 22
2
1
0
BaseLine 1 month 3 months 6 months 12 months
FIG. 5.20
Variation of frequency with time.