
Page 138 - Big Data Analytics for Intelligent Healthcare Management
P. 138
5.8 RESULTS, INTERPRETATION AND DISCUSSION 131
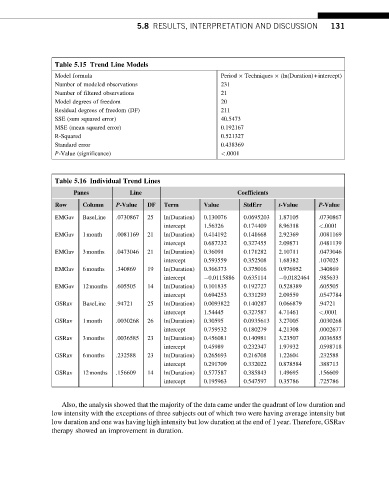
Table 5.15 Trend Line Models
Model formula Period Techniques (ln(Duration)+intercept)
Number of modeled observations 231
Number of filtered observations 21
Model degrees of freedom 20
Residual degrees of freedom (DF) 211
SSE (sum squared error) 40.5473
MSE (mean squared error) 0.192167
R-Squared 0.521327
Standard error 0.438369
P-Value (significance) <.0001
Table 5.16 Individual Trend Lines
Panes Line Coefficients
Row Column P-Value DF Term Value StdErr t-Value P-Value
EMGav BaseLine .0730867 25 ln(Duration) 0.130076 0.0695203 1.87105 .0730867
intercept 1.56326 0.174409 8.96318 <.0001
EMGav 1month .0081169 21 ln(Duration) 0.414192 0.141668 2.92369 .0081169
intercept 0.687232 0.327455 2.09871 .0481139
EMGav 3months .0473046 21 ln(Duration) 0.36091 0.171282 2.10711 .0473046
intercept 0.593559 0.352508 1.68382 .107025
EMGav 6months .340869 19 ln(Duration) 0.366373 0.375016 0.976952 .340869
intercept 0.0115886 0.635114 0.0182464 .985633
EMGav 12months .605505 14 ln(Duration) 0.101835 0.192727 0.528389 .605505
intercept 0.694253 0.331293 2.09559 .0547784
GSRav BaseLine .94721 25 ln(Duration) 0.0093822 0.140287 0.066879 .94721
intercept 1.54445 0.327587 4.71461 <.0001
GSRav 1month .0030268 26 ln(Duration) 0.30595 0.0935613 3.27005 .0030268
intercept 0.759532 0.180279 4.21308 .0002677
GSRav 3months .0036585 23 ln(Duration) 0.456081 0.140981 3.23507 .0036585
intercept 0.45989 0.232347 1.97932 .0598718
GSRav 6months .232588 23 ln(Duration) 0.265693 0.216708 1.22604 .232588
intercept 0.291709 0.332022 0.878584 .388713
GSRav 12months .156609 14 ln(Duration) 0.577587 0.385843 1.49695 .156609
intercept 0.195963 0.547597 0.35786 .725786
Also, the analysis showed that the majority of the data came under the quadrant of low duration and
low intensity with the exceptions of three subjects out of which two were having average intensity but
low duration and one was having high intensity but low duration at the end of 1year. Therefore, GSRav
therapy showed an improvement in duration.